I was digging around the county historical society lately because I thought it would be fun to find where my relatives made a land claim when they arrived in the US. Plat maps, which track ownership, were not updated on a routine basis in the days of primary forests and pioneer wagons. This one was done in 1884, and the next printed update didn’t get published until 1902. Even though the family of five children, all born in Norway, are said to have arrived in 1874, the family name has yet to appear here. It does in 1902.
What you do notice is the number of parcels denoted by St. Paul Minneapolis and Manitoba Ry Co. or St. P. M. & M. Ry Co. These parcels were owned by the railroad built by James J. Hill. The school land is also a major player. There were 168 schools in Leaf Mountain Township. The forty acre plots with no names listed, or US, are the ones open for homesteading. It seems the US government priorities rolled out in that order: transportation, education, and homesteaders to make it all work.
Railroads received 9.9 million acres of Minnesota land from the federal governmentโmore than the 7.3 million acres claimed by homesteaders between 1862-1880. The Homestead Act’s promise of land for ordinary settlers shifted when railroads got the biggest share. Now itโs difficult for any major infrastructure project to command overarching commitments.
It’s no surprise that the homes abutting a freeway are a bit cheaper than similar homes with a buffer from the noise and hubbub. A recent paper, The Traffic Noise Externality: Costs, Incidence and Policy Implications was clever in using the construction of sound barrier walls to calculate the markets preference for a home protected by the wall versus one that was not.
The authors come up with a figure of 6.8%, which in itself is not as crucial as the acknowledgment that a public goods project, such as erecting a barrier wall, uniformly corrects the imposition of a busy road across a blanket geographic area. There is a market for public goods. A consistent, non-exclusionary response to a public goal reflected in the impassionate exchange of cash for homes.
The impact of the wall’s benefit, or the detriment of a noisy road, is reflected in the nearby neighborhood. There are other impacts resulting from the existence of the road and its location. It allows people to get to jobs. It might be an emergency route to a hospital where people object to the use of sirens. Buses might run off the road and so on. For that reason the net effect of the road is best taken as a package with the ability to divvy out and assess the pro’s and cons as refelcted in the surrounding land values.
To make a jump and try to use changes in house prices to make a meaningful observation of the traffic composition is a stretch. To extrapolate the value of home price change and reflect that back onto individual cars driving down that road, as the authors of The Traffic Noise Externality simply don’t follow me. It seems it would be a categorization problem.
One thing to note if you are planning a trip to Denmark is that you can rely on public transportation with confidence. In Denmark, this covers trains, commuter rail, metro, buses, and the availability of bike lanes (of which there are shockingly many). Just because it is said that a bus will be at a certain place at a certain time, it does not always mean that it will be there. And if you are in a foreign place, you don’t have the background to think, Don’t worry, the E11 always runs a little late.
Cutting back on concerns is essential when you are on a trip. They are time-consuming. They make you rethink your plans. They drain the fun out of the adventure. And maybe they are the best way to judge the efficacy of a provided service.
In Denmark, all metro, commuter trains, and inter-city trains are accessible via an app. It’s straightforward and easy to use. You can book as you stand on the track. The bus schedules are also available electronically and at each stop. On board, the screens display the time, stops, and the time of arrival at each stop, among other information. A subdued Scandinavian kerfluffle of concern arose on one trip as the wagon had to stop at the central station and not continue as planned to the airport. There was an instant sharing of information among riders to ensure everyone was in the know.
Rail infrastructure is present across the country, whose land mass is only a fifth the size of Minnesota, but whose citizenry is very similar. With the main corridors of population running between the higher-density areas, it is not surprising (in a way) that rail can be the dominant form of transportation. In an area like the northern tip of Jutland, where the rail network is limited, buses take over. As far as I could tell, most of the towns enjoyed regular daily service.
If you are making travel plans from afar, it’s significant to know that not only are the towns, cities, and hamlets accessible, but they are reliably and frequently visited. You might have a UNESCO-rated Viking archaeological site on your list of must-sees, and you know you don’t have to rent a car to reach it. Nor do you have to fudge in extra time if your timing is off in such a way as to miss the one bus that goes through the area. A traveler doesn’t worry about contingency plans or estimate the risk of not having transportation.
Renting a car is possible, but it’s expensive, costing $60-$90 per day. And then you have to pay for gas and parking. A one-hour bus ride up to Lokken, a beach town on the North Sea, costs DK94, or just under $15 โseriously.
Lastly, you will find that the vehicles themselves are well-kept and clean. School children, teens, and adults of all ages trundle on and off them with noticeable familiarity. No need to fear being laughed at or judged for not following any particular protocol. Everyone is simply going about their day. Using the extremely reliable, well-networked, optimally supplied sources of transportation that their governing body chooses to provide with a substantial subsidy.
In the context of car insurance pricing, a territory is a geographic area defined by insurers to group locations with similar risk profiles for setting premiums. Territories are typically defined using the following methods and delineators:
1. ZIP Codes: The most common delineator, as ZIP codes provide a standardized way to segment areas based on localized risk factors like accident rates, crime statistics, and claim frequency. Insurers may use individual ZIP codes or aggregate them into larger territories. [2][16][19]
2. Custom Territories: Insurers may create their own territories by combining ZIP codes, counties, cities, or townships into broader zones. These are designed to reflect similar loss experiences, traffic patterns, or demographic characteristics. For example, multiple adjacent ZIP codes with comparable risk may be grouped into one territory. [11][13][14]
3. Census Block Groups: For more granular analysis, some insurers use census block groups (small areas with 600-2,000 people) to define territories. These allow for precise risk assessment in densely populated or diverse areas. [16][19]
4. State-Regulated Territories: Some states impose rules on how territories are defined. For instance, Connecticut uses 18 predefined territories, while California requires territories to be at least 20 square miles and prohibits single-ZIP code territories to ensure fairness and avoid overly specific pricing. [13][14]
5. Geocoding: Insurers use geocoding tools to map a vehicleโs primary garaging address (where itโs parked most often) to precise coordinates, ensuring accurate assignment to a territory. This helps account for variations within larger geographic units. [18]
Territories are defined based on data like accident frequency, vehicle theft rates, vandalism, weather risks, traffic density, and claims history, which help insurers assess the likelihood and cost of claims in a given area. The boundaries are set to balance statistical homogeneity with practical considerations like regulatory compliance and administrative simplicity.
Two recent articles by prominent housing policy voices reveal a shared concern about the structural limitations of the YIMBY movement’s traditional approach. Both Chris Elmendorf’s “YIMBYism started as a single-issue movement. It’s time to think bigger” and Matthew Yglesias’s “The power of a single-issue group” examine how YIMBY organizations have operated as focused advocates for increased housing density, but each author suggests that this narrow framework may need evolution to achieve lasting success.
The Competitive Model of Single-Issue Advocacy
Both authors describe YIMBY groups through a similar structural lens: as collections of people united around the singular goal of increasing housing density through land use reform and community lobbying. This approach has positioned YIMBY organizations as competitors in the arena of local politics, where they must vie against other community interestsโfrom neighborhood character preservation to parking concernsโto secure favorable outcomes.
This competitive dynamic has been YIMBY’s strength. As Elmendorf notes, “The signal advantage of one-issue groups is that they can work with almost any legislator. By not taking stances on peripheral issues, they avoid making enemies.” Similarly, Yglesias emphasizes that “the strength of YIMBYism over the past 10-15 years has largely derived from its single-issue orientation during a time of relentless political polarization.” The movement has achieved bipartisan success across diverse political landscapes precisely because it hasn’t alienated potential allies by taking controversial positions on unrelated issues.
However, both authors identify a fundamental limitation in this competitive approach. When YIMBY groups operate as single-issue advocates, they inherently position themselves in opposition to other legitimate community concerns rather than as partners in comprehensive neighborhood improvement.
The Case for Pluralistic Collaboration
The articles converge on a crucial insight: sustainable support for housing density may require YIMBY groups to embrace a more pluralistic approach that considers multiple public goods simultaneously. Rather than competing against other neighborhood priorities, they could collaborate to address the full spectrum of urban challenges.
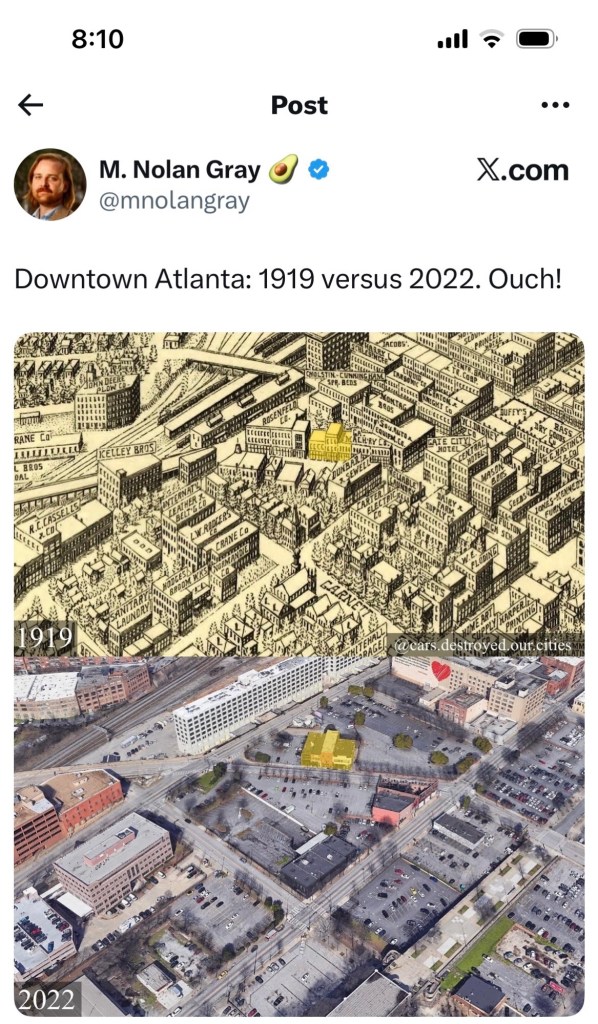
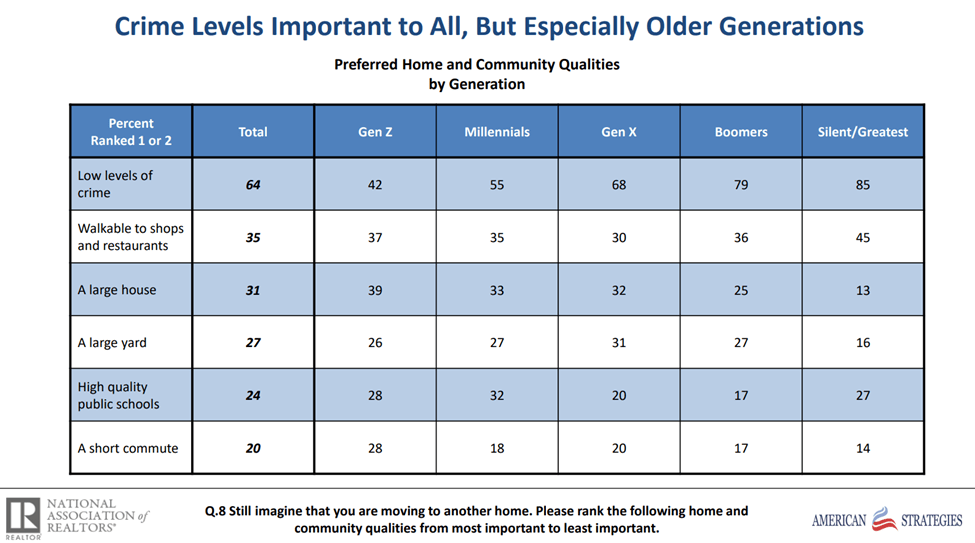
Elmendorf argues that this shift is not just strategically wise but empirically necessary. His research reveals that “people who feel good about big cities want existing cities to become more canonically city-like.” This finding suggests that support for density depends heavily on broader urban quality of lifeโincluding schools, transportation, public safety, and cultural amenities.
Yglesias acknowledges the value of this broader approach while defending the continued importance of single-issue organizing. He recognizes that multi-issue coalitions can offer something valuable to skeptical neighbors: addressing their concerns about construction impacts by simultaneously improving schools, transit, and safety.
Beyond Zero-Sum Thinking
The structural shift both authors envision moves beyond zero-sum competition toward collaborative problem-solving. Instead of viewing neighborhood concerns as obstacles to overcome, a more pluralistic YIMBY approach would treat them as legitimate issues requiring integrated solutions.
This doesn’t mean abandoning the core mission of increasing housing supply, but rather embedding that mission within a broader framework of neighborhood improvement. As Elmendorf suggests, such an approach could offer community members a compelling trade-off: “You may not like all the buildings, but you’ll love the great schools, safe streets, fast transit, and thriving business that we’ll deliver.”
The Challenge of Multiple Public Goods
Both authors acknowledge the complexity of this transition. Weighing multiple public goods requires sophisticated political judgment and potentially controversial prioritization decisions. A group focused solely on housing can avoid taking positions on education funding or transit investment; a multi-issue coalition cannot.
Yet this complexity may be precisely what sustainable urban policy requires. Rather than treating housing, transportation, education, and public safety as separate domains competing for attention and resources, effective urban governance demands understanding their interconnections and potential synergies.
Conclusion
While Elmendorf and Yglesias differ on whether YIMBY organizations should fully embrace multi-issue coalition building or maintain some single-issue focus, they share a recognition that the movement’s competitive, narrow approach has structural limitations. The path forward likely involves both preserving the strategic advantages of focused advocacy while developing new organizational forms capable of the pluralistic collaboration that sustainable urban development requires.
The evolution from single-issue competition to multi-issue partnership represents more than a tactical shiftโit reflects a deeper understanding that creating livable, dense communities requires addressing the full spectrum of residents’ concerns rather than simply winning narrow victories on housing policy alone.
I flew into Missoula today and the Montana Airport is wrapping up a major multi-phase expansion that reshapes regional travel and brings broader economic shifts in its wake. Here are some of the details:
The Physical Build-Out
Total Cost: Over $110 million for the full terminal expansion.
What’s New: New gates, expanded baggage claim, rental car lanes, security upgrades, and room for new routes and carriers.
Who’s Paying: a combo of the Feds and private interests
Federal: More than $50 million in grants, mostly from the Bipartisan Infrastructure Law.
State & Local: Matched funds from the Missoula Economic Partnership, businesses, and banksโno local tax dollars used.
Recent Boost: A $6M federal grant (2024) will help complete the next terminal phase.
Skyward Travel Growth
Missoula set a passenger record in 2024: Over 1 million flyers, up nearly 12% from the year before.
Targeting 1.5 million by 2044 as travel demand soars.
Now offering more frequent flights and year-round service to Chicago, thanks to an $875k federal grant.
The Ripple Effects
๐ University of Montana Perks
Easier access = stronger recruitment, research partnerships, and conference travel.
Out-of-state students now find Missoula more reachable and appealing.
๐๏ธ Housing Pressures
Expansion is fueling demand for housing, especially near the university and airport.
Rent hikes are real: Locals report steep increases, with โaffordableโ now starting near $1600/month.
Development impact fees (passed on to buyers) may also be contributing to rising costs.
๐ผ Local Economy
Jobs during construction and in airport operations.
Tourism boost: More flights mean more visitors spending at hotels, restaurants, and shops.
Stronger air links help regional business and health access.
๐ง Challenges Ahead
Affordability squeeze: Residents and students are feeling the pinch from rising rents.
Infrastructure stress: More travelers and new residents will test city roads, utilities, and services.
Equity concerns: Growth must be balanced to include long-term residents and low-income communities.
Final Approach
Missoulaโs airport expansion is more than a construction project โ itโs a gateway to growth. With smart federal funding and local vision, the region is positioning itself for a more connected future. But keeping Missoula livable as it grows will take coordination on housing, transportation, and community needs. How would one go about making some projections? Estimates of impacts and time frames could be interesting to local public leaders.
Chris Arnade is a city walker and a people watcher. He recounts his impressions on his Substack, Walking the World. Recently, he participated in a conversation on Conversations with Tyler, which is well worth listening to for those who travel to learn and love to travel.
There were several terms in the conversation which I will be using more frequently in references to city life. The first one is best described in a photo.
Organic Street Life
Localized Distribution- “Meaning there’s always a shop somewhere.”
The Normal Experience- As in this passage:
Then I started saying, โWell, I should . . .โ When I was in Brooklyn, I walked the entire length of the New York subway system above ground. Iโve always been into walking, and I just realized, โHey I can just . . .โ I think I was looking at a table that about 1.5 billion people live in massive cities that we really donโt know the names, these big sprawling Jakartas. Iโm like, โI would like to see that.โ
COWEN: Yes, agreed.
ARNADE: Thatโs the normal experience for most people, and so I just started. I booked a trip to Jakarta and just started walking Jakarta.
The normal experience is where all the cool data is. What’s to be done with extraordinary events? They simply are not that interesting except for daily fodder.
Covered bridges were built for several practical reasons, primarily in the 19th and early 20th centuries:
1. Structural Protection: The covering shielded the wooden bridge framework from weather like rain, snow, and sun, which could cause rot, warping, or cracking. This extended the bridgeโs lifespan significantly, often by decades.
2. Durability and Maintenance: By protecting the load-bearing timbers, covers reduced maintenance costs and the need for frequent repairs, which was crucial in rural areas with limited resources.
3. Safety for Travelers and Livestock: The roof and sides provided shelter for travelers during storms and kept the bridge deck dry, reducing slip hazards for people, horses, and wagons. It also calmed livestock crossing narrow bridges over rivers.
4. Snow Management: In snowy regions, covers prevented heavy snow accumulation on the deck, which could weaken the structure or make it impassable. Some bridges had sloped roofs to shed snow easily.
5. Aesthetic and Cultural Value: Over time, covered bridges became iconic, with communities taking pride in their design. They often featured unique architectural styles, reflecting local craftsmanship.
6. Economic Considerations: While adding a cover increased initial costs, the long-term savings from reduced maintenance and replacement made it a cost-effective choice for wooden bridges.
Most covered bridges were built in North America, especially in the U.S. (e.g., New England, Pennsylvania) and Canada, where timber was abundant, and weather was harsh.
Although it is fair to keep in mind, or rather it is essential, to keep in mind that many other factors could contribute to the drop off in new housing permits in the city. If you can think back to the last time you made a housing decision, what were the core attributes of your new place to live? Perhaps safety. Crime is up in the city. What else? Perhaps schools. School performance and attendance rates are down. Perhaps proximity to work. Many employment situations went with a remote model, leaving the downtown core empty, reducing the premium to be close-in.
There are many variables that contribute to or detract from the desirability of living situations. Zoning has an impact, but it is way down the list of the core features that impact people’s daily lives.
Say you live in a high-density, well-frequented area where lots of people come and go to visit local amenities like ballparks, restaurants, and museums. At some point, you get tired of being unable to host book club because your friends can’t find parking in front of your home, or the noise of continual foot traffic along the sidewalk is plain annoying. You decide to do something about it. After all, this is your homeโright?
The voluntary action taken to rev up the neighbors, petition your city council, and air your grievances across social media platforms can, in sum, add up. It is an opportunity cost to you. You’ve engaged in volunteering and spent some of your time and talents to improve your environment. In fact, you’ve done such a good job that there is now a team of neighbors- Team A- all on the same quest.
Traditionally, streets and sidewalks are open-access town amenities. It’s too inconvenient to block passage for those from afar and those nearby. Hence, most roadways in the US are public in the most generous sense of the term. The free flow of people circulates around for their various needs, whether it be for a commercial delivery, a commuter getting to and from work, or a family out and about doing what families do. People in the know might adjust their schedule and stay off the roads at rush hour or following a Taylor Swift concert, but otherwise, it is a free-for-all, first-come-first-serve type commodity.
Team A, in the neighborhood wants more control than the anything goes, and engage their city to intervene in the spirit of preserving their neighborhood. They make a material claim to the pavement outside their doors. In order to make it official, they need the blessing of an official body with authority. The constraints change once a sign goes up on the block limiting parking hours, or requiring a parking pass.
Imposing minor inconveniences like restricted hours, passes, or even meters might make street parking more orderly. It’s a way of relaying information. A restriction might be just what someone needs to make an effort to drive through the alley and put their car away in a garage. A small charge encourages people to walk further and park on a less busy street.
The time to take note is when a restriction pushes other groups to form. Then, there are more preferences to consider than simply those of the neighbors who want ownership benefits of the street spots in front of their homes. Take the recent change implemented for those who wish to drive into Manhattan. To listen to this guy, it’s all a great success to charge $9 and discourage entrance by vehicle. He appears to speak on behalf of the commuting group.
Screenshot
What other groups are in the mix? Shoppers who would come into the city, but now the surcharge discourages them? Small shop workers like home repair people? Tourists who decide against coming in for the day? What is the cost of their behavior in the face of this new constraint? It seems that retail shops and restaurants could see a decrease in business. Less competition for small-scale home repair services results in higher prices for homeowners. Fewer tourists, as pesky as they seem, weakens the arts and museum support systems.
Time will tell. But it seems that gaining a little bit of ownership of the asphalt might cost Team A more than the time it took to lobby for the change. Commuter Team B may benefit the most, as the $9 is a fraction of the income they earn in the city. And the othersโworkers, shoppers, and touristsโall lose out. After all, there’s no free lunch. But more importantly, is this matrix of tradeoffs between various interest groups the desired outcome of implementing the surcharge?
If you google ‘health determinants, ‘ a bunch of stuff scrolls out in the feed, but none of it is exactly the same. For example, the World Health Organization‘s (WHO) site reports:
Determinants of Health
Many factors combine together to affect the health of individuals and communities. Whether people are healthy or not, is determined by their circumstances and environment. To a large extent, factors such as where we live, the state of our environment, genetics, our income and education level, and our relationships with friends and family all have considerable impacts on health, whereas the more commonly considered factors such as access and use of health care services often have less of an impact.
The emphasis is on a person’s situation in life more than on their genetic make-up or even access to health care services.
The US Center for Disease Control (CDC) offers a helpful graphic to describe their social determinants.
If you look at the hexagon you might note that the categories remind one of public goods. These goods are provided at large as they are thought to generate a universal effect that benefits everyone. If people are more educated, they will understand how to stay home with a virus so as not to pass it along to others. The availability of health care and clinics provide ease of treatment. The built environment includes transportation routes for ambulances and fire trucks to speed up a person in need. People fare better in safe communities enhanced through public provisions police services.
These categories line up nicely with the categories at Home Economics. Because the social determinants of health are also the determinants of a stable and vibrant neighborhood.
What isn’t provided at either of the sites are details. When one drills down to the street level, what can one measure that represents safety? Is it the number of pedestrian fatalities? Homicides? Or carjackings? Which number best represents safety?
Numbers meant to quantify school performance are subject to manipulation. Is the highest performer in a medium school really better off if they become a slightly above-average performer at a high-performing school? In the first instance, the student may evolve into a leader, one who expects more from themselves. Whereas in the second scenario they shrug off the duty to perform as there are so many better students in the lead. Yet competitive parents are expected to seek out the ‘top’ schools for their child- folklore says they are the best predictors of educational success.
Another factor that seems to be omitted is the level of dedication an individual, family, or community has to contribute to health issues. It’s one thing to live near a dentist, but if you never take off work to make sure your kids get in for a check-up, it does little good. Do the kids get on the school bus so they don’t trundle in late and disrupt the class? Does a neighbor ensure the octogenarian across the street gets in for their monthly treatments? How much work is going into these public health projects?
Neighborhoods are a rich source of social determinants. Combine that with a bit of information about volunteerism and who knows where that could lead us?
Randy Clark has gotten a hold of a turn-a-bout momentum, bringing the DC metro into an about-face toward ridership satisfaction. Is there a method to his madness? First, consider the background, from the Washingtonian.
Clarke arrived in Washington at a low point for Metro. In July 2022, the Omicron variant was causing a midsummer spike in Covid cases and DC had one of the highest rates of remote work in the country. Bus and rail trips were still stuck at about half their pre-pandemic levels. The previous October, a relatively new 7000-series train had derailed on the Blue Line in Arlington, leading to a rebuke from the National Transportation Safety Board.
The metro chief was not a train enthusiast from the start. But as he went through school, he became fascinated by how transport touches many other aspects of life. People need to connect with each other and travel the distances to do just that, which gives the service a public flair. This sets up the juggle between the funding flow from governing bodies and the satisfaction of the general population.
There are two sometimes conflicting areas of public-transportation management: (a) politics, or how to obtain funding and craft policy, and (b) operations, or how to make trains and buses run safely and on time. An effective transit leader has to excel at both.
The payer and the end user are disjointed. So how does a manager of such a system tie the money and the product together?
A regular rider, Clarke has a commuterโs perspective on Metroโand an executiveโs fluency with how it works. Onboard, he tells me about the relative quietness of the systemโs tracks (they use massive lengths of continuous welded rail, so they donโt make the loud click-clack of, for example, the New York City subway) and the stretch of track where trains travel fastest (the tunnel between Rosslyn and Foggy Bottom).
It’s hard to get payers on board when the users are unhappy with the product. Clark dedicates himself to changing that.
When the system is working poorly, Metro can feel dated, even a little sad. But when itโs working well, itโs easy to feel the pride behind its creation. Clarkeโs fans credit him with restoring that feeling, and he believes vibes matter. When transit infrastructure is broken and dirty, he says, riders and local politicians get frustrated. They ride less, drive more, andโconsciously or unconsciouslyโdevalue the system. By contrast, when trains and buses run frequently and stations feel clean, riders feel more pride and lawmakers believe the system is worth supporting.
Priming the pump to lure riders back to the metro is only one side of the story. The funding side is more complicated for this public good because 1. it has no dedicated funding source, and 2. its ridership draws from Virginia, Maryland and DC. Clark must shake out the individuals who place train transit at the forefront of their priorities. He is looking for the individuals out of the three groups who share this transit goal.
For now, Clarke is riding high, the closest thing to a rock star local transit has ever known. And heโs not changing his hands-on approach. As he rides the rails, he notes any problems he sees: Recently, he pointed out a broken gate to a station manager, and repairs were soon made.
There were very, very few minority neighborhoods in the area in 1947. Hence, 98% of displaced people were plain-Jane everyday folk. Here are the demographic numbers for the time that the Interstate was built.
When you can do something this cool with data, why not stick to it and skip the drama?
In a recent post about time prices, the excellent Jeremy Horpedahl noted that workers are better off today than in 1924 except in the cost of housing. These comments are rooted in data compiled by Anthony Davies.
Rent is shown to be less expensive than in 1924 in small and medium cities, not more expensive, and by quite a bit. Living in a small city today only costs the worker 4.7 days of labor versus 1.3 weeks in days of yore.
However, consider the increase in the cost of living in a large city, shown at 2 weeks versus a week and a half. Doesn’t the proximity to work and services save workers a considerable amount of time? Many people who live in smaller towns or rural areas commute long distances to work. They drive to larger commercial centers for shopping and medical services. In an emergency, an ambulance service can run up a large bill.
Aren’t there considerably more services in the large cities than in 1924? In addition to road transit, there is access to international airports. The city is also the heart of entertainment culture, from major sports franchises to fine arts and musical venues. Conferences take place in the city, and universities are located there. Cities provide the landscape for all the restaurants and eateries where politicians and leading business figures congregate.
When you rent in a large city, part of what you pay is the capitalization of the entrance fees to many more social enterprises that were not available in 1924.
Government is really good at saying ‘no.’ Rule-making is all about saying “don’t do this” and “don’t do that.” Sometimes solving problems means saying yes. Like, yes, we can fix that stinky, polluting car. In steps the philanthropic entrepreneur, Environmental Initiative.
Launched in 2017, Project CAR works with local car repair shops to cover the cost of fixing emissions control and exhaust systems for qualifying lower-income Minnesotans. Nearly 600 cars have been repaired since the program began, eliminating 32 tons of emissions. Project CAR is focused on fixing the estimated 25% of passenger vehicles that cause 90% of vehicle air pollution in Minnesota.
Folks who are driving the car which contributes the most to declining air quality are also stretched by other priorities.
Cathy Heying, executive director and founder of The Lift Garage, an established partner of Project CAR, praised the programโs expansion, expressing enthusiasm for the collective impact such partnerships can generate. โCustomers come in with all sorts of needs, and, often, environmental impact is not their top priority due to cost constraints. So, this program is amazing because customers want to do the right thing for the environment and this program allows them to do that while also improving their carโs functionality,โ she said.
This non-profit ends up offering a two-for-one. They provide people with transportation to go about their daily lives and they reduce a negative externality to the local public. All this without interfering with the owners’ everyday flow of finances and obligations.
What other low hanging fruit are our there for the entrepreneurs to capture?
In the latest round of environmental review versus the world (or do it my way legislation), the boxers are the almighty climate combatants versus those who request a road expansion. I should qualify. When I say ‘request,’ I mean demonstrated demand through usage. If the roadways are full, then it’s safe to say that the participants find travel along that freeway by car best suits their needs. Once vehicles come to a standstill on a commute, they are polluting an extra amount by idling. Managing the road system to facilitate flow keeps emissions lower.
A new law passed last year requires an environmental review before authorizing a roadway enlargement. Calculating a social cost at the time of the transaction, like a road installation, is an interesting thing to do. It should be done in conjunction with calculating of all the other benefits prompt and efficient transporation offers, such as getting the elderly to their doctors’ appointments or kids to their extra-circular activities, as well as getting commuters to their jobs.
Residents are dong that all the time. Cars cost money to own and maintain. Consumers will use them when they are their best option. Denying a population access to a road enlargement pushes them to substitute less desireable options. These are less attractive not because of their love affairs with the car, but most probably because they eat into their time and ability to achieve their other daily tasks.
If the goal is to reduce trip miles, then study populations who achieve success at all their goals while using the fewest miles. How is their matrix of choices allowing this to happen? What are their priorities and how did they achieve them. I can promiss one answer. It isn’t because a bureaucrat squeezed their road improvement project.
They’re called influencers when they hit soccial media venues peddling cosementic products and outfits. Pop mega-star Billie Eilish isn’t hawking commodities. She’s pushing for people to make a sacrifice for the environement. Instead of enjoying a new outfit, settle for a used one. Instead of going solo in a vehicle to her concert, pair up and carpool.
โHit Me Hard and Soft,โ Eilishโs third album, is due out May 17. For the tour, she is focusing on sustainability and is continuing her longtime relationship with environmental nonprofit Reverb, to which sheโll donate a portion of proceeds from ticket sales. Sheโs also encouraging fans to carpool or take public transportation to her concerts and to wear thrifted or borrowed clothing rather than purchasing new. Fans are also invited to bring an empty reusable water bottle as there will be free refill stations at the venue.
Reminding people to do their part toward a common goal is one way to advance its objective. Another is to pass a law. No plastic straws, for instance, was meant to help the environement.
What I wonder about is which of these to strategies has a bigger impact, and to what degree? Spitballing it I would guess that someone of Eilish’s stature teases out more action, probably a lot more action. It wouldn’t be that hard to measure the ridership of the audience memebers.
I wonder why there aren’t more efforts to nail down the results of some of these strategies. If a mega-star can generate more significant results than a law. Skip the bannings that no one pays attention to and hire the influencers to change the world.
The Uber/Lyft conversation in the Twin City area provides material to illustrate the dual nature of transactions. Let’s revisit the players. The drivers provide a service to riders for a fee. They also use a platform which takes a cut of the fare in exchange for technology services and national branding.
Drivers left the taxi structure back ten years ago or so. And it does not sound like they want to go back to the taxi arrangement and work for a boss, but are encouraging other ride share companies to enter the market. They are disgruntled with private pecuniary measures, yet satisfied with the soical benefits and flexibility of the job.
Riders are pleased with the services at today’s pricing. Present public transit options like the bus or metro mobility are actually cheaper but do not replace the service. The groups that would be most damaged by the loss of the ride share structure, since there is no substitute, are disabled folks and those who use it to go bar hopping. The social detriment to the first group would be internalized by loss of freedom and a reduction in trips to their medical appointments. Social detriment would be externalized through outcomes from drunken driving.
Another group of riders would have an impact on local businesses and conventions. The travelers who arrive from elsewhere in the US are familiar with Uber and Lyfts through their national presence. Their apps are already downloaded on their phones and they know the drill. The travel community is worried about how removing this transit option will be externalized onto their business.
Other ride share providers have always been able to enter the market. Drivers have always been able to seek out other work at traditional taxi oulets and other types of driver opportunities like school bus driving. (There are regular job postings for this in our districy choice.) Now that Uber/Lyft’s departure may be eminent, five other platforsm are said to be interested in the market. Yet there are regulatory costs.
Uber and Lyft’s threat to leave the Minneapolis area has sparked a lot of interest from outside players. But the cost of operating a ride share business is not for the faint of heart. It costs $37,000 for a license in Minneapolis, plus another $10,000 wheel chair accessibility fee. St. Paul’s license fee is $41,000. MSP Airport requires a $10,000 security deposit and a $500 license fee.
Separately, it costs about $150,000 to secure a commercial auto insurance policy for a rideshare company.
The issue around the driver’s fare split is presented, politically, as the wealthy corporate boss taking advantage of a punch clock worker. This isn’t the turn-of-the-century, nor are we talking about a factory. And since the platforms have yet to make a profit, that visual is difficult to sustain. But this broohaha may be the trick to get other companies to enter the market and have a go. Should they offer drivers a better cut, then the labor flow will move over to the ride share platform.
— Frederick Melo, Reporter (@FrederickMelo) March 25, 2024
The key in all this is freedom. If drivers have the freedom to work as taxi drivers, or bus drivers, or drivers for ride share platforms, then they will gravitate to the best situation for their private interests, leaving the failing apps to die off. If riders find services that better suit their needs, then their business will filter over to new options.
Picking numbers and setting up a dam in the system inadvertently sets off financial as well as social repercussions without clearing them through the numerous social structures involved.
Adam Smith closes out Book Four, Of Systems of Political Economy, of Wealth of Nations by telling us the duties of the sovereign.
According to the system of natural liberty, the sovereign (Commonwealth) has only three duties to attend to; three duties of great importance, indeed, but plain and intelligible to common understandings: first, the duty of protecting the society from the violence and invasion of other independent societies; secondly, the duty of protecting, as far as possible, every member of the society from the injustice or oppression of every other member of it, or the duty of establishing an exact administration of justice; and, thirdly, the duty of erecting and maintaining certain public works and certain public institutions, which it can never be for the interest of any individual, or small number of individuals, to erect and maintain; because the profit could never repay the expence to any individual or small number of individuals, though it may frequently do much more than repay it to a great society.
Wealth of Nations, Adam Smith
We no longer have sovereigns, but we can see those duties in our local governance. And thus we can expect citizens to evaluate each of them in turn.
Yesterday’s post revolved around Adam Pratt’s framing of the groups with a stake in Uber & Lyft’s departure from Minnesota, in his article Getting to the Big Picture on Rideshare. Today’s post tries to sort through which groups will have a thumbs up or thumbs down on their value outcome.
Pratt describes how the two tech companies were able to enter into a market and survive for a decade without making a profit.
Like some tech companies of the era, Uber was funded with billions in venture capital to allow it a path to viability. And like other tech stars of the era, that glide path lasted over a decade and allowed Uber to price its service below cost and pay drivers more than it could profitably afford.
The profit motive is important. If a private company is a going concern, then it needs to make a profit under the existing constraints. So many of the tech companies blasted through traditional ways of doing business and shut them down. Or disrupted them, as the then-popular phrase went. But in effect, only some of the new platforms delivered enterprises that ended up being profitable. And for Lift and Uber to make a go of things, part of the restraints is the objectional driver wages.
There has always been a subsidized transportation system available to the public. And this journalist, H Jiahong Pan, did a fantastic thread outlining all the options. He points out that many of them are less expensive than the ride shares. These buses don’t have routes is one of his articles about micro-transport but read his thread for all the details.
For those wondering what to do with Uber and Lyft leaving Minneapolis, Uber leaving the 7-county Twin Cities:
You have options.
— h jiahong pan ๆฝๅๅฎ โ๏ธ (@h_pan3) March 16, 2024
In effect, Uber & Lyft became a subsidized ride system for more than a decade. The consumers preferred it as it was timely and came to your doorstep. If you are blind, for instance, this can be world-changing. It wasn’t because it was cheaper. Others who benefit from the private subsidy (gift from private VC) are all those others who could have paid for a taxi, or driven their vehicle, but preferred a ride if they were going to throw back a few.
All riders will lose convenience with the departure. But those on the low-income scale will be most inconvenienced. Those on the mid-to-high income scale will replace the service with other for-hire drivers. Those who drink and drive could suffer, and cause suffering.
If anything, new information about the market should give public transit clear directions on what customers value. After all, even though a profit motive is not entirely in play, ridership is still a measure of the performance of the various public transit options. In many cities tracking of public transit is available online so riders can make their connections.
The drivers who need a full-time driver positions can transfer to public transit driving and earn quite a bit more money as well as benefits. The thing is, if they had wanted those jobs, they would have already made the switch. Most probably they don’t want to be committed to a boss and a schedule and they benefit in some way from the flexibility of being self-employed. All those who were doing it part-time just lost their part-time gig. Many side jobs are lower paid without benefits. It seems like this group, which is quite large, will lose out financially.
The politicians can tally a score in the win column. They went to bat on an issue and won. But to say they can account for a positive value in the people-over-profits net sheet is very much in question.
It looks like Lyft and Uber are leaving Minnesota- the tech company sent out a notice to all their customers to that effect. This was brought on by the biggest city’s city council who voted to set price controls for wages within their municipal boundaries. But the political backlash to this political control-grab is snapping quick and hard as it seems there are many other groups who value the service and price of Lyft and Uber.
Thankfully a journalist has written the whole kerfuffle all out from the view point of groups. (Perhaps he’s an institutionalist.) Here’s Adam Platt’s essay Getting to the Big Picture on Rideshare in Twin Cities Business magazine of which he is the executive editor.
The big picture refers to group 1, Minnesotans. He’s looking to break down not one issue, the issue that was the bee in the bonnet of the activists, that drivers (who fall mainly into group 2, first generation immigrants) fight to challenge the oppression of low wage labor imposed by a corporation. The political entity who has the elected power to carry out the move was chosen by group 3, the residents of the largest city.
But it turns out that even parts of group 3 find themselves together with other Lift and Uber riders, Group 4,in that they are poor, handicapped and disadvanted themselves. They use the service regularly as public transit does not accomodate their needs for a variety of reasons. And a group of other politically elected officials across the metro in particular, group 5, are putting pressure on the only person in the state who can intervene, the Governor, to put an end to this Marxist, but not really, tale of oppressed labor.
The irony of it all is that group 2 (the drivers) are independent contractors not wage earners beholden to a no-face factory-boss. They work when they want. They break when they want. They set their own plan. So what Adam Platt also elucidates is that the whole political play goes contrary to established structures of paid labor versus self-employment. It’s really a very interesting twist on villanous characterizations with the whole red march theme.
In all seriousness, this article is worth the read. Adam Platt lays out the details both with a historical perspective and with an accounting of all the groups in play. Analysis of these issues are never a dichotomy. And only with a sense of where things originated, and in what direction are they heading, can a proper analysis be done for a stab at the best outcome for the most people.
These are the grand national and social forces which have come into existence since the time of the Communist Manifesto, and have nullified what otherwise might have been accurate predictions of that Manifesto. For Karl Marx had based his calculations upon the purely mechanical, economic evolution of machinery, of tools, of markets, of supply and demand. He had not weighed these spiritual and psychological forces which have revolutionized the modern world. He had not seen beneath the economic forces. He had not seen the power of patriotism by virtue of which the divers classes of these different nations would finally unite. He had not seen the movement of trade unionism through which laborers learned to organize, learned self-control, learned to negotiate with em-ployers, learned that they need not fall back into the pauper condition that Marx predicted, but that by negotiation, by arbitration, they might make an agreement with the capitalists, that they might come to terms with the capitalists and divide the product between them.
The spirit of trade unionism, instead of being that of class struggle, is the spirit of partnership. The trade union movement looks upon itself, not as the irreconcilable opponent of capitalism, but as & member of the family. Being a member of the family it is entitled to have a row with the head of the family, and to live apart for a time, but it has not yet taken out a divorce. Trade unionists do not presume, as Karl Marx did, that the members of the family can do without the head of the family. Trade unionism is based upon that principle of partnership which we see in & different way in the home. Consequently here we have a spiritual movement which has not attacked family, religion, and property, as Karl Marx had done, but has organized itself to get a larger share of profits by negotiation, by agreement, by strikes.
Industrial Goodwill, John R Commons 1919
Why didnโt the Austrians appreciate John R Commons?
Yesterday’s post describes a coming to terms between some neighbors over a paving project. It might seem like a one-off situtation because of how the properties were arranged along the road. And it is true that many blocks of homes are developped together and hence laid out with conformity. But when you think about it, the sheer number of miles of road make non-comforming layouts pretty common as well.
Which suggests that a bartering of tax payment in exchange for a road improvement happens frequently. You might say there is a matrix of possible solutions to who pays what based on some combination of property ownership and use-value. There could be other interesting variables as well like how much social time had to be contributed to initiate the process, and shepard it through, and even how much time went toward diplomacy so the individuals who thought things weren’t fair would still go along with the project.
And this is all assuming that the folks, as in the story, know enough about each other and their general alikeness to foster a degree of trust.
Things can get more complicated quickly when some parcels are owned by commercial entities and some by individuals. There can be divergence in the income levels of the various parties involved which contributes to an evaluation of who could carry the burden better. In other words the players can be grouped. In doing so an order may emerge that shows the bartering results in consistent outcomes.
Knowing some of these results could be helpful. It could help with planning, to be able to know in advance the most typical way the numbers all shake out. It could save some upfront hastles for those just starting out on a project. It also could help prevent fraud when the groups need to be subsisdized. In this situation the bartering is done by a bureaucracy which tends to take some teeth out of the trades.
There could be some benefit in knowing the final settling of cooeperative projects. As there isn’t just one mile of country road. There are millions.
It’s unclear to me why some stories from one’s youth stay with you and some don’t. I must have keyed into my grandmother feeling self-concious about a financial sparsing of the cost to pave over the county road which serviced their home. Whenever there are costs and people and public goods, there is bound to be a bunch of judging on who is doing what and whether it is enough.
My grandparents lived on a gravel road on the outskirts of a small town. They also owned the farmland along their side of the road. Across the thoroughfare the land had been parceled into perhaps twenty homesites. For many years a gravel surface was considered adequate, despite the layer of dust left on a car going to and from and despite the washboard effect that eventually appeared and made the vehicles tremor as the wheels caught the dirt ridges.
At some point, enough neighbors got together and decided it was time to make a request to the township to pave the road with asphalt. This takes a bit of work. There’s a process. Enough of the residents need to be interested to start a government agency’s wheels in motion. The cost of the improvement shows up as an assessment where, in many cases, the cost to the homeowner is based on the number of feet of frontage to the road.
At least that’s the standard setup.
But in this case my grandmother objected. Her theory was if they all got the same use out of the road, then that is what should determine how the expense should be covered. Afterall, they don’t expect people from Bemidji to pay, even though in theory anyone from Bemidji can use the road. The residents on the road each come and go with a similar frequency, and fair would be to say those who use it split it equally.
My grandmother was savvy enough to know that property ownership would play into her final bill for this public amelioration. But she didn’t think she should have to pay 20 times more than the folks across the road simply because her farmland abutted the pavement. Furthemore, she realized that her lack of support for the project could endanger it from going forward.
I’m not sure where the numbers settled exactly. The road has been paved ever since. What is interesting is that this story is an example of a bartering in order to come to a cooperative solution to community improvement. All these neighbors were of similar standing. It would be difficult for any of the others to call out two educators as evil landowners. It was just a group of neighbors, in a small town arriving at a balance between use-value, property ownership and resources.
In the first three chapters of Capital Vol 1 Marx throws down his founding priciples of capitalism under the premis that labor time is the ubiquitous unit of measure. He does conceed that the quality of labor time, and hence its ability to be productive, is influenced by other factors.
The value of a commodity would therefore remain constant if the labour-time required for its production also remained constant. But the latter changes with every variation in the productiveness of labour. This productiveness is determined by various circumstances, amongst others, by the average amoun of skill of the workmen, the state of science, and the degree of its practical application, the social organisation of production, the extent and capabilities of the means of production, and by physical conditions
Capital Vol 1- Karl Marx
Think about this list. 1.The skill of the workmen 2. State of Sciene 3. degree of practical application 4. social organization of production 5. capabilities of means of production 6. Physical condition.
Couldn’t this list be 1. Quality of public education available to workforce 2. Technology 3. Vo-tech adaptation of technology 4. Governance of plant 5. Degree of logistical support including maintenance and transportation 6. The environment.
No matter what specifics came to Marx’s mind as he wrote this list- the list appears to point to what we now call public goods. The productivity of the labor hours invested depended on the quality of the public goods inplay at the plant.
.
David Harvey has an excellent YouTube series on Capital
I was triggered on Twitter. (oops X). I saw a post that vilified suburban sprawl as ‘we all subsidize’ it. It’s been a while since I’ve heard that rally cry against the natural course of a metro area to seek out inexpensive growth. The claim, which is never followed up with any data or research, implies that the public costs to the outward growth of a city drains public resources.
But all growth or redevelopment is subsidized. Developers receive tax benefits and incentives for work in urban areas as well as suburban areas. Roads are built and maintained with funds at the local level, the county level, the state level and even the Feds drop a few bucks for the interstate system. Since employers are located all across a metro area, there is no guarantee that a city dweller commutes less than suburban dwellers, they just travel in a different direction.
The old dichotomy of the urban versus the suburban is so passe. First tier suburbs are now appraoching 80 years old, which is about how old the core city was in the 60’s when this whole vilify the middle class folks who simply wanted a nice little 1800 sqft one-and-a-half-story on a .14acre with a sidewalk lot started.
Let’s put to rest the image of a cool (yet always suffering) urban core that needs to be cherished, protected and preserved by fighting courageously against the nasty exclusionary suburbs. Instead, envision a dynamic, interesting and ever-changing melange of housing choices that serve as the dwellings for the several million people who want to cluster in a large metro area.
The National Association of Realtors conducts a poll every three years around community preferences about their neighborhood and transportation. Here is the Executive Summary from the last report which was just released:
Results from the 2023 Community and Transportation Preferences Survey generally continue the trends from previous surveys. Residents in the top fifty metropolitan areas remain split on what they look for in a neighborhood. One noticeable difference is a modest uptick in measures of importance of walkability.
In general, people in the largest 50 MSAโs are satisfied with the quality of life in their communities โ as they have been in each of our previous surveys. If they were deciding where to live today, they would place high importance on low levels of crime, sidewalks and walkability, as well as short commutes and easy access to the highway. In terms of priorities for their state and local governments, about three-quarters of residents place the highest priority on maintaining and repairing roads, highways, freeways and bridges. A number of other issues are in the second tier, with half placing a high priority on building more roads, expanding public transportation, providing alternatives to driving, and developing more walkable communities. Most Americans continue to agree that they like to walk and drive, while almost half agree that they like to ride a bike and in an uptick from previous years, 44 percent like to take transit. The things that keep people from doing more walking are places being too far away to walk and the need for a vehicle for work or school.
I think there can be problems with stated preferences, as it is only when one must choose that one realizes where their preferences lie. That said there is a lot of interesting information in the report. Note first that personal safety will never go out of style. It will always stand well above other priorities.
The surprising number in this chart, one I would challenge, is the relatively low importance of schools.
Core issues such as road maintenance continue to be a need voiced by all generations.
If you thumb through all the slides you will see that the gas tax is not popular.
This tweet garnered bicycle enthusiasts’ expected collective (scornful?) sigh. The Prof is out of touch and out to maintain the status quo. The activists are on the right side of history and will ride in on mechanical transportation, victory torches ablaze. But in the article, both parties are guilty of obstructed views.
First, consider the professor’s opinion that emissions increase when traffic quieting and bike lanes are installed. One would think there is research on this. It makes sense that when vehicles take longer to arrive at their destinations they emit additional pollutants. But intuition is not a substitute for facts. Even a report from taxi drivers verifying additional time taken to deliver passengers through said areas would be helpful. I judge claim number one as a fail. It makes sense to me but no proof is offered.
There is an indirect claim in the number of emails generated for support of bike lanes. The coalition is noted to have sent out a total of 93,000 emails. I’m not buying that there is a live citizen behind each of these carpings to elected officials. I have an inkling that a scan of the electronic documents would reveal automated generation. For claim number 2 in the matter of mobilized residents I give a fail. Spamming of office holders also takes their time away from other issues.
Another pressing issue that falls in the same interest group of concern for the climate is the decrease in transit ridership. The serious drop in locals who use light rail and busses is real and documented. It’s all green lights for claim number 3. And hence this would be one of the areas that should attract time and attention.
Safety is always on the top of people’s priorities. I’m not sure I follow the cliams being made about mortality and walkers. Pedestrian deaths were at an all time high in 2021 but compared to what and are the numbers still quite small? That said I’ve seen and heard about a lot of accidents regarding older riders in particular and their road experiences. Encouraging recreational weekend cylists to tackle roadsharing with four thousand pound chunks of metal seems a bit precarious. Claims about safety strong but not intirely thorough.
I know people who bike to work year around. They love it. It gets their day started with a vigorous activity that gives off energy throughout the day. It can’t possibly be that difficult to track two-wheeled commuters. A city can also use counters to enumerate the activity on trails and roadways at times to give estimates. The demand for bike lanes can be measured in better ways than spam. An same goes for pollution. Reader at intersection in before and after scenarios is easy enough.
If officials want to make sensible decisions they’ll need to look to everyday folks. Will a core group utilize the infrastructure or is it an appeasement to people who want to feel they are making a difference?
Iโve never met anyone who has regretted a visit to Banff National Park. Just an hour and a jig west of Calgary, Alberta making it easily accessible via an international airport. Regular bus service transports worldwide visitors up to the spectacular peaks. The mountain range is stunning. Summer, fall, winter, or spring, nature will impress you by washing the skies in pale blue and then fluffing out a smattering of white clouds through the valleys.
We generally come in the winter to ski at Lake Louise. Two hills in the areas, Sunshine and Mt Norquay combine their ticket sales under Ski The Big Three. But we stick to Louis. Even in years such as this one where the snow is scarcer than they would like and the tips of boulders are peaking through some of the moguls. How can anyone pass up that view?
A nice Brit took this picture of us today. He threatened to walk away with my phone and laughed at his ruse (and clearly gave me back my phone). On some of the runs, you can see Chateau Lake Louise and the lake beyond. Both it and the Banff Springs Hotel were built by the Canadian Pacific Railroad in the 1920s to encourage tourism into the park. In recent years the park attracts about 4 million visitors a year. Many stay in the town of Banff which is about forty mintues east of Lake Louis.
For us, one key component is the ease of transport. It’s easy to get up to Banff with all the ski/board equipment. The airporter drops riders off all along Banff Ave and up on Tunnel Mountain. Likewise, comfortable coaches pick up from strategic spots amongst the lodging choices to get skiers up to their hill.
If you need a connector shuttle, the city of Banff has several routes running through the town of 8000. This one is waiting out a six-minute pause before his next circle starts. He’s pulled up into a large camping area that is packed with people and their RV’s and campers in the summer months.
Whether you need a ride up to the park from the airport or around the ski hills or through the quaint and historic town of Banff, they have you covered in the most convenient ways.
Local urban geographer Bill Lindeke does a nice job describing how a building boom finally came to fruition along the first light rail line in Minneapolis. When the Blue Line went in eighteen years ago, there were heightened expectations that new construction would line up along this aging railway corridor from downtown Minneapolis out to the airport. But it took time.
That was 18 years ago. And ever since, for the most part, the pace of transit-oriented development has seemed glacial. According toย Metropolitan Council studies, more than 12,000 new apartments have been built along the Blue Line since its opening. But if you glance at a map, the vast majority of this construction has been downtown, or else subsidized in some way. For most interstitial stops along Hiawatha, south of downtown, thereโs been very little new housing construction. Even the rosiest development booster would have to admit itโs been a slow climb.ย ย ย
What I remember from selling single-family homes is there was an increased interest in those within a handful of blocks from a rail stop. The houses along there are modest for the most part, and the prices ran with the metro average, so younger people latched onto the opportunity for great access to downtown Minneapolis. No need to drive to work and pay exorbitant parking. No need to drive to your favorite ballgame or watering hole. Just hop on the rail line!
The premium in the sales prices of these homes could easily have been verified by anyone with an excel program. With proper splicing of access to various public amenities, regression analysis can parse down the amounts paid for all sorts of public amenities. Improved access to transit is certainly on most consumer’s minds. Still, the price push wasn’t enough for new construction.
โIt really boils down to rent levels in every neighborhood,โ Sweeney said. โHistorically, rents in (Longfellow) were too low to justify much new construction. Few projects worked here (and so) while there were a few things built 10 years ago, you didnโt see a large boom. But area rents have grown, which allows new construction to be feasible.โ
Sweeney is the developer who has put up two new apartment buildings along the Blue Line in recent years. Policymakers and pundits want to theorize about housing solutions, but people like Sweeney and the investors who support his group are the ones who have to be able to make the numbers work. A bonus for transit infrastucture is just one component of price.
Another valid issue discussed in the article is the various timeline for the pace or even appearance of new construction in older areas. The story tells of a tipping point for this neighborhood. Still to be discussed is a more thorough overview of the neighborhood components that green light building.
One upside during the pandemic was the light traffic on the roads. For two years it was completely unnecessary to think through whether rush hour would delay one’s arrival. There was no need to buffer in extra time, no need to avoid travel at certain hours of the day. It was a public service windfall.
We have no toll roads in Minnesota, so roads are a classic, open to everyone, public amenity. (Well- there are a very small number of gated communities, where austere gates carry signs stating ‘Private Drive’ even though said gates are wide open to entry.) When lots of people are using the roads, it costs me money in extra use of my time. More or less the opposite dynamics to a private good.
Roads can also externalize negative private benefits when they are in ill repair. Hitting a large pothole even at moderate speeds can throw your alignment out of place. And this is why people get on the phone with their city council person and demand to see sand and tar trucks out filling holes in the neighborhood. Not everyone gets their cars damaged, and not everyone needs to call the city council person. But if the average guy/gal provide the feedback, and expectation are pursued, then the whole benefits.
Before dismissing local politics as boring, think for a moment at how many levels these tasks of feedback and correction occur. Property owners take care of their driveways, sometimes under duress from neighbors. Associations, cities, counties, and townships all have ownership and maintenance responsibilities. Then there are state highways and the Federal Interstate system. Motorists may not give a second thought to the land under the pavement they are passing over. But there is competition for resources between each system.
I recently overheard a conversation where it was pointed out that the county snow removal vehicles were parked in our city. This is a windfall. Their trucks must plow a few hundred yards of city streets before getting to the county roads. Although both the city and the county provide a public service, each acts as a private competitor when interacting with one another.
So even though roads are public goods, they can cost me privately in time during congested periods and repairs due to poor maintenance. They also function like a private good (in the sense of competition for resources) between the levels of government responsible for the system’s interconnected parts. And there are lots and lots of levels of economic interaction to keep it all in good repair.
Like dueling twin cities, there is an ongoing feud between those who love the city versus those who prefer a suburb. Here are a few reasons why people move out to the burbs. I present these in no particular order other than how they come to mind.
Many buyers desire privacy. They want their own space and don’t really want to feel obliged to interact with their neighbors. It’s not to say that they don’t greet the resident across the street with a cheery hello- it’s just that they want to be able to retreat behind their four walls if they so desire. There is a little more elbow room on a .25-.31 of an acre lot which is standard in the burbs, than on a city lot which runs about half the size.
Less drama. That’s how an acquaintance explained it long ago. When you pull back your front shades and see a guy sleeping in his car in a pile of refuge, you wonder if you should go investigate. It’s not that he is causing you any harm, but you feel like you should go check on him. This happens far less out in the burbs.
Many suburbs offer reliable transit access to a central city around business hours. It is a myth that dwellers in the urban core do not require a vehicle whereas suburbanites do. I make this claim through observation, but I’d love to see statistics that prove me wrong.
The core cities indeed have many more restaurants. But the burbs have a greater selection of grocery and big box type of shopping all with easy access. Any store that needs space, Ikea, car dealers, REI, and Best Buy, will find space in less dense areas.
In Minnesota both the burbs and the city value parks and trails. But there are more lots in the outer areas which have views onto nature areas, marsh lands, and waterways. Since people find happiness in nature, this also edges the suburban options up a nudge from the city.
There’s a lot to love in all areas of a metro area. Luckily everyone likes a slightly different combination. It is a bit silly to poke fun at one area over the other when it’s clear that there are plusses and minuses to all options.
All we’ve heard for the last several years is how the price of housing is going up. Up. UP! And for the most part that is true. Whether it is because Millennials are finally getting on their feet and need a place to have their own families, or whether the baby boomers are not moving to the lower priced condos and giving up their family homes, there is no doubt that there is a housing squeeze.
But seriously, for as long as I can remember, except in deep recessions, people have thought housing is expensive. Because it is! It is the largest portion of people’s monthly budget. And this distraction about the cost of a home is the most uninteresting fact one can take away from home prices. House prices are a rich reflection of the revealed preferences of a community.
An economist in the early part of the twentieth century by the name of Paul Samuelson came up with the idea that when consumers chose different products, they reveal what best suits their needs. This differed from theories up to that point which placed the burden on policy makers to decide which goods provided the greatest utility to consumers.
Samuelson’s relationship with economics is lengthy. This excerpt paints the broadest brush of his brilliance. “In receiving the Nobel Prize in 1970, Mr. Samuelson was credited with transforming his discipline from one that ruminates about economic issues to one that solves problems, answering questions about cause and effect with mathematical rigor and clarity.”
One economist, his junior by twenty years, heard the clarion call for greater mathematical representation of economic theory. Zvi Griliches contributed to a publication called Economic Statistics and Econometrics published in 1968. In a paper called Hedonic Price Indexes for Automobiles: An Economic Analysis of Quality Change, Zvi pulled apart the prices for automobiles so that he could show how much consumers were paying for improved engines or length of the vehicle or other features. By comparing the components of the cost of vehicles he distinguished between inflation and consumers revealing a preference for higher quality provided by advanced technology.
But back to real estate. The economist credited for using this statistical method (taking the price of a complex product and using data to divvy out the weighted values of its various components) was Sherwin Rosen in his 1974 paper Hedonic Prices and Implicit Markets: Product Differentiation in Pure Competition. Now this is exciting! The price of a house can tell you how much one school district is favored over another. It can tell you the value effects of violent crime, or proximity to mass transit.
The implicit prices tell us that we trade in public goods as well as private goods. We shop for city services and good roads, for youth programming and parks, as well as for good schools and safe streets. The implicit prices tell us how groups of people choose bundles of public goods. Real estate prices are incredibly rich with feedback.
Most coursework taught in a classroom setting under the guise of real estate is centered on one of three aspects: appraising, financing, and legal underpinnings. In fact, most of the reports generated around real estate feature these same three topics. The recent sales data is sliced and diced along with market times and the rates offered by the mortgage brokers.
Cornell University proves to be an exception in its course offerings which include a wide range of topics on all aspects of real property. In addition to the oh-so-common Finance and Investment class, there’s a taxation course and one on hospitality real estate finance. There is analysis of transaction and deal structuring, and advanced project management for real estate development. There is an emphasis on flushing out the business side to real property.
But the courses designed to teach the work which happens(ed) in the home has been severed from the neighborhood and become Policy Analysis & Management (PAM). The evolution of the 1920’s department of the Department of Household Management is depicted in the flow chart below. Clearly 1969 was a breaking point from the quaintness of home, a throwing off of the apron in favor of an upwards and onwards momentum to a more distinguished framing.
Another course offered at Cornell is Urban Economics and Real Estate Markets. The course description reads: “A theoretical understanding of the economic forces affecting urban land market change and development is needed for decision-making in the real estate profession… The two core models at the center of the course are the model of urban spatial structure that stems from the work of Alonso, Muth and Mills…” (Alonso, William (1964) Location and Land Use. Cambridge: Harvard University Press.)
A few years before the functions of health and human services were being detached from the geography of cities and suburbs, Alonso noted that the location of a central business district (CBD) created a spatial relationship within a city which affected real estate. While a model based on jobs and income and the commuting of a workforce was used and developed in the interplay of real estate uses in a city, the jobs of a homemaker in educating and feeding and educating her children found a new home in the Health and Human Services Departments across the nation.
There’s been a lot of celebrating today with the final presidential signature scratching ink across the infrastructure bill’s pages. It’s a lot of cash, that’s for sure. This was the speculation, a few weeks ago, on how the dollars would shake out for Minnesotans:
As with other recent large federal spending bills, the state has some idea what amounts will flow from the various categories but will have to wait weeks, perhaps months, for specific guidance on how it can be spent. The state usually spends about $2 billion a year on road and bridge work from fuel taxes and bonding and will likely receive an additional $4.8 billion over five years for that purpose from the federal law.
In addition to roads and bridges, early estimates are that Minnesota will also get $818 million for public transportation; $680 million for waterworks; $297 million for airport improvements; $100 million to expand broadband access; $68 million to expand electric vehicle charging networks; $20 million for wildfire protection; and $17 million to increase cybersecurity.
I recently switched to an iphone after years of android use. It has been fun to compare their functionality. The ease of the transition is a tribute to Apple’s focus on the user experience. There is one feature, however, that I miss. It is Google Lens. My last phone was Google Pixel and the Google Lens icon is at the lower right hand side of the screen when you open a jpg. For instance, as I sort through some old travel photos from my youth, I often want to know where a shot was taken. Check Google Lens- Presto! It matches the image to ones on Google Maps.
Fath Ali Shah
I tried all sorts of methods to store and open this image from Iran on my new phone but gave up, and went back to my Google Pixel. Tapping on the picture on my old device summoned up web results which identified the location in seconds. The 4000 BC etching is located under a fortified wall at Rey Castle, near Teheran. Subsequent postings by the collective of google map supporters offered views of the image and surrounding landscape from multiple angles.
More than likely I’ll discover how to use Google Lens on my new device. But the fact that so many features are user friendly and this one is not made me reflect on how we are at the mercy of structures easily within our reach. And how we don’t make time (partly because we may not appreciate the benefits) of structures which we have yet to discover.
During the lockdown my family and I started a daily walk routine as it is good exercise and it was one of the few activities open to us. We used aps to monitor distances and times, and struck out looking for new scenic trails. I’m not sure how many times we shook our heads in disbelief that we had only now discovered so many pleasing miles in our figurative back yard.
On a recent trip to Calgary I discovered the ease and reliability of public transit. It was forced on me by the difficulty to secure a rental car in the era of Covid. This reminded me of when I took my kids on the Great Northern Railroad from Minneapolis to Glacier National Park. The line runs from Chicago out to Seattle skirting the northern most border of the US States. It appealed to me as it gave me a break from road tripping with young children and I thought it would make an impression on them. Many of the other passengers from places like Minot, Culbertson and Wolf Point used the rail frequently. It was their preferred form of transportation.
The dominance of some IT structures has made me wonder about other patterns in my life which have steered my activities. Where else have decisions kept me from advantageous experiences? What other take-it-for-granted services are people not using optimally which would make their lives better? And how can we reveal those little connectors to better engage a just-next-door infrastructure we have yet to discover?
There are many types of two sided games that people play. Say a politician devotes a large share of his time and energies to a light rail project which in the end is funded. He has a bragging rights to getting a project through, a resume builder. But in his own life he has no interest in using mass transit. It’s inconvenient. It’s time consuming and he’s a busy man.
Or consider the high-priced neighborhood’s reaction to the light rail line plundering down along a low use section of rail, right behind their carefully painted turn-of-the-century homes. No- no rail here when there are so many better routes! Law suits. Delays. The same folks who entertain mega-donors on verandas decked out with overflowing flower planters, raising funds for the morally upright party, have a thing or two to say about transit for the masses skimming exclusive dominium.
Then there are the folks who will use the transit for commuting as it is the best option for them. They will consider the location of the rail in the choice of their housing and their employment. Their lives are not devoted to political activism or moral considerations. Even though the thought of cleaner transport may appeal to them it is a straightforward balancing of accounts and utility which drives their decisions.
There’s a separate accounting for the time and energies and dollars for each of these actors in the development and consumption of light rail.
I so enjoyed using the light rail in Calgary that it got me thinking about transit and what it means to a city. Ironically it is Covid that put me on the bus in the first place. The rental cars were all booked, and I have family in the city, so I wasn’t dependent on public transport. I wanted to use it to give myself a little independence. What a pleasant surprise to find it so convenient, clean and timely.
(The other companion structural hardscape I noticed were the frequent pedestrian bridges arching over the thoroughfares. They lead people to the light rail stops, of course. They also bridge neighborhoods, which is very useful for parks and trail access. But I digress, back to transit.)
It is no longer controversial to say that real estate home values increase along light rail lines. Studies are easy to come by. Here is a section from a piece posted on the Federal Reserve Bank of St. Louis’ site.
Property Values and Development
One benefit of light rail is its potential impact on nearby property values. There is much academic literature on this angle.
The research generally finds that rail transit has a positive impact on residential property values, although the impact is relatively small. One study found that property values in Portland, Ore., increased by $75 for every 100 feet closer a home is to a light-rail station, and the average home price in New York declined by about $2,300 for every 100 feet farther from the station.[1]ย In another study of the Portland rail system, the authors found that home prices increase as a result of being closer to a rail transit station, but the effect was only significant within 1,500 feet of the station.[2]ย Another study found that the typical home in San Diego sold for $272 more for every 100 meters closer to a rail station, but the distance to a rail station in Sacramento had no significant impact on residential property values.[3]
See the problem with the analysis? There is a pretty potpourri of measures. And the use of dollars (as opposed to percentages), as if property values in Portland are the same as New York or San Diego. The distances from the stations are in feet and meters. Then an observation is made that the effects are small– compared to what?
In math, every problem starts with definitions. You can’t very well solve for something if you haven’t determined what is at stake. We know that the public good transit exerts an externality on the private good, a home. But how does it work?
It has been a while since I’ve posted a vintage photo, so here is a scene from Addis in about 1974. The wall in the foreground encircled our residential compound, separating our house from all those along the road below. In parts it was studded with broken glass, and stood at ten feet above our yard, dropping fifteen or more to the road below.
The tall eucalyptus trees frame the edges of the photo. This is appropriate as their distinctive smell lingers in every memory of the mountain top capital. Fresh and pungent.
A smoke also lingers amongst the branches as there was always a fire lit, smoldering out of a cook top or a chimney. Although the daytime temps can be warm, the high elevation promises a cool night’s rest. Back then most women snuggled into the white muslin wraps just like the figure striding down the road.
Come morning the roosters were as reliable as the rising sun, beating the rays to the shuttered windows at announcing day break. Our first night in that house, with jet lag still playing on the rhythm of the waking hours, the crowing was unexpected. Exotic. It wasn’t long before the sounds of roosters were the steadfast signal of life on a new day.
Maybe difficult to pick out in the picture is all the corrugated tin which was (still is?) the roofing material of choice. Rust isn’t a problem, I think, due to the elevation. But when the rains come the clatter is impressive! It makes one feel extra dry to hear exactly how much water those roofs protect you from.
The recent pictures I’ve seen of Addis are nothing like it was when we lived there. There were no skyscrapers. Bole road to the airport was the only thorough fare. So I don’t know if the red clay roads such as the one by our house are still maintained by the pounding of foot traffic and donkeys loaded with bundles of firewood.
Someday I hope to return for a visit and find out.
Post note: Our Addis house is one of the tiles in the banner for the blog. Can you guess which one?
A few years ago we visited Norway as a family, retracing a few familial heritage sites. It was great fun as we had done a similar trip some forty years earlier. This time we were working off research my cousin had done through Ancestry.com and thus had honed in on additional family farms throughout the Oslo to Bergen area.
One memory from stepping off the plane back in the 70’s was that all the kids were blond and tall like me. After living much of my childhood in Asia and Africa, this was delightful. Similarly, on the more recent trip I kept having feelings of deja vu, when the waitress was slightly sarcastic like my cousin or the viking haired checkout guy nodded and chuckled in repressed good humor. Returning to an ancestral home can be a reflection back upon one’s self and one’s family. For me there was undeniable comfort in my surroundings.
Back when my ancestors left the country in the mid 1850’s most all travel was through the fjord system as the mountainous landscape makes for difficult road construction. The ferry system is still a significant player in the transportation infrastructure as it was in the 70’s. We drove along narrow roads with stunning vistas across fog filled fjords. But there are many more tunnels through the mountains now. In fact Norway boasts the longest tunnel in the world.
At an astonishing 15 miles (24.5 km) long, the Lรฆrdal Tunnel is the worldโs longest. Costing 1 billion Norwegian kroner to build (that’s about USD $110 million) the tunnel connects the small communities ofย Lรฆrdalย and Aurland.
Its design is admired all around the world, as it incorporates features to help manage the mental strain on drivers. Every 6km there is a cave to separate sections of road.ย The lighting varies throughout the tunnel and caves to break routine and provide a varied view.
Here’s a fun game you can play if you are presently in the market for a home. One could consider a variety of home characteristics, but if you are in the market for a school district, the pricing lines should be very crisp. And you must be in the market for your own family. Speculating on what others will do just isn’t the same.
If you are not familiar with hedonic regressions, it is a mathematical process where given a set of data, which is subjected to an equation built with defining characteristics, the numbers reveal the various levels of importance of each feature. If we are looking at housing prices, the coefficient in front of the school district data will tell how much of the home price was dedicated to that selection.
But you don’t have to be a math geek with access to a bunch of data to come up with a result! I’d say any buyer who is seriously evaluating this choice can shoot from the hip (after looking, bidding and seeing the values the properties commanded at close). Ideally you want to be considering two school districts which both contain similar homes to choose from within their school boundaries– say a 90’s built two story with four bedrooms up and a nice yard for the kids.
Even non-number types of buyers will be able to discern the differences when their money is in play, or their abilities to access other ideal features. School districts can swing a home value price as much as 15%, so on a home of $450K, a $67K difference. That’s noticeable. And consistent opinions about districts, which affect a great number of buyers, filter out in the numbers.
Buyers do not need regression models to calculate the price of other features. The distance to job centers, for instance, or the premium for a prestigious neighborhood. People will pay to be closer to work in order to spend less time in the car. They will also pay for neighborhoods with corner restaurants, quaint historical business crossroads and neighbors with recognizable names. The numbers here are large enough so that no pointy pencil needs to scratch out a calculation.
But there are hundreds of neighborhood features which are priced out in the offer on a home. And many of these could be better understood with the help of a little math.
I happen to be by the Blake Rd light rail stop today and snapped a few phone pictures. It is really something how concrete is poured into suspended molds. The MSP area has been reluctant to put money into this sort of infrastructure– and there is plenty of money involved. But once a line is up and running, the fans show up and hop on board. It will be interesting to see how the need for commuting evolves as corporations entertain employment at a distance.
Southwest LRT at a Glance:
The approximately 14.5-mile route (PDF) will serve the growing communities of Minneapolis, St. Louis Park, Hopkins, Minnetonka, and Eden Prairie.
16 new stations with connections to streets and trails will be built, attracting new residential and commercial development.
In 2014, there were approximately 64,300 jobs within ยฝ mile of the proposed stations and 126,800 jobs in downtown Minneapolis. By 2035, employment is expected to grow to 80,900 within ยฝ mile of the proposed stations and 145,300 in downtown Minneapolis โ a 18% increase in employment.
In 2014, there were about 35,800 people within ยฝ mile of the proposed stations and 16,400 residents with access to the 5 shared stations in downtown Minneapolis. By 2035, the population within ยฝ mile of the proposed stations is expected to grow by 56 percent to 55,800, and the population of downtown Minneapolis is expected to grow by 117 percent increase to 35,600.
The total project budget is $2.003 billion, funded by a combination of federal, county, state and local sources.
An estimated 7,500 construction workers will be needed to build the line, with $350 million estimated construction payroll.
The total project cost is $2.003 billion. Committed funding sources for the Southwest LRT:
Hennepin County: $591.4 million
Counties Transit Improvement Board (CTIB): $218.9 million (provided funding until dissolution in 2017)
Hennepin County Regional Railroad Authority (HCRRA): $199.5 million
State of Minnesota: $30.3 million
Other local contributions: $26.4 million
Eden Prairie Town Center Station: $7.7 million ($6.14 million CMAQ, $1.54 million Eden Prairie)
The Federal Transit Administration (FTA) will provide $928.8 million through the New Starts program with a Full Funding Grant Agreement which was signed in September 2020.
If there were a ranking for ‘the best’ public goods– how would it go?
A public good here at home-economic is a good which a group makes available to everyone in that group. For the purposes of this list, let’s extend that delineation to the political boundaries of the US. What are the public goods here in the United States that promote a service to its constituents, while maximizing individual freedom?
I’d have to say the winner is our road system. Most all roadways in the US are open to anyone’s use. Except for a handful of toll roads, there is no charge to the user, and little restraint in their availability. Furthermore there is timely efforts to keep them clear of obstacles.
I started with drinking water, but many people in the US use private wells. And then there was that problem in Flint and the complete absence of water in a number of spots in California.
Then I thought personal safety– which is the oldest public good. Here again, the variance in quality provision of protection varies too much across the states to say that it is consistently available.
Education is meant to be…but we all know the pitfalls here. Even though we do it much better than most.
Nope– it’s definitely the roads. More people have access to the open highway than other pubic good.
There’s another aspect to the platter system which deserves a little thought. The rules put into play at the higher, overarching levels need to be the most useful to the most people. If they are too specific, they set the lower platters, or ecosystems of exchange, a kilter, setting up rules to counter act the rules.
Take a subway system as an example. The governance and maintenance of the infrastructure is managed as a system for a large population. The NY subway handles over 3 million rides a day. So in terms of setting user fees, the calculation is done with inclusivity in mind, pricing so as to be accessible to the most people, in this case of upwards of 20 million residents
User fees work well in carrying the cost of water delivery, but come up short in paying for sewer line replacement. User fees in subway systems are also insufficient in maintaining the physical structure. In sewer lines it is easy to assign the replacement cost to each dwelling. In metro stops it is less clear who should pay.
As different locations benefit to different degrees from their proximity to the subway stop and the line, who benefits the most from a particular piece of the system is more difficult to identify. But those who enjoy its use the most, are also those who are most likely to be agreeable to paying a surcharge in order to preserve its use.
Similar to the example of waste water removal, the daily patrons at any metro stop are the most likely to realize a tangible benefit. Another way to put it is the people who use the property, apartment towers, businesses, shoppers, office complexes, realized a benefit and hence receive an increased value in rents, level of employee employee satisfaction, and so on. Wouldn’t it be great is there were price signals to tell us how much they would be willing to pay?
Being able to price out the maintenance expense would realize another mid-level platter efficiency. The building owners who do not value the proximity to the subway, and hence would find the maintenance assessment a burden, would be incentivized to leave the property. There maybe ten other desirable aspects to their building keeping them in place. Hence they stay put neglecting the benefits of mass transit.
But if the market value expense of subway maintenance were great enough, the building owner may move five blocks away from the subway line where some combination of the ten other features would maximize their needs. By not have to pay for the line, which they don’t value, they voluntarily relinquish that space to others who value it more.
When new construction goes in, the cost of putting in sewer lines, roads, curbs, and so on are built into the price of the purchase. Developers are only able to go forward with a project if there are buyers who would pay for the package– including infrastructure costs. Last time I checked, these ran around $25-30K per household in Minnesota.
If all the decision making is done at the largest, most encompassing level of cooperative agreements, then then there is a glossing over of the pockets where the benefits are compounded. Infrastructure is an amenity to an entire city, and those who travel to see it. But to afford such a significant amenity, the details of all the various levels of users and daily riders could be better understood.
I’m a sucker for images, and these new graphic representations at the intersection of maps and data are lovely.
A consulting firm out of North Carolina, Urban3, has a new measure for assessing the productivity of land in an urban environment. It’s an interesting new twist.
Urban3 makes maps that show the value of city buildings on a per-acre basis. That last detail is the kicker.
โWe make the models to provide information equity,โ explained Joe Minicozzi when I asked him about his approach. โWe show a financial picture of whatโs going on with the cash flow. You see where the holes are, whatโs doing well, whatโs not doing well. You canโt see where youโre leaking your money if you donโt know whatโs going on.โ
The general process is to take the tax revenue on the section of land and divide it by a spatial measure. Under this calculation, downtown buildings are more ‘efficient’ than suburban malls with lots of surrounding acreage of asphalt parking spaces. And in this way the analysis has flaws. Consumer (pre-covid) enjoyed the ease of mall access. Downtowns discourage shopping traffic. So if the objective is to encourage downtown visits, an understanding of transit and traffic and parking would be more valuable.
Reframing a means of analysis is exciting, but there are many more features of the built environment than simply tax collection and land space.
Around 4pm this afternoon the temp in the Twin Cities creeped above zero ending a 95 hour streak of negative highs and lows. As far as I know there have been no deaths during this polar vortex. But down I35 W, past Iowa, Missouri, Kansas and Oklahoma, a tragic 133 vehicle pile up left 65 hospitalized and 6 dead in Texas. The winter weather conditions coated the interstate with glare ice jackknifing semis across the thoroughfare. Approaching cars helplessly collided into each other as they skated into the metal mangled mess.
Around the same time last week, in Minnesota, a “bridge appeared to be ice-covered when the driver crashed and nearly went over the edge…”Take a look at the video where bystanders stopped a pickup from teetering over a bridge rail into the Minnesota River. When it comes to winter weather, Minnesotans have high state capacity. As a group we have the extra skills and initiative to respond to unexpected winter weather challenges.
It’s not that the people down in the Lone Star State are hick, uneducated or inept. It’s not that they’re too poor to be responsible nor too rich so as think they’re above it all. It’s not that they are too stupid or too smart. Capacity is a combination of knowing what to do, and being able to engage when the need arises. It’s an identification process, a communication process and a step-up-if-you-are-there-and-available process.
The group has to have the expertise to distinguish the glean on the pavement as black ice, and not innocent damp asphalt. A network has strength to communicate the concern when it is reliable and trusted. Parents put in the extra ‘no’ with persistent teenagers who want to go meet their friends, errands are put off. Stories of cars sliding into holding ponds and drivers waiting through the night, half submerged, until someone comes to the rescue, are retold to confirm the nature of the situation. All these activities enforce behavioral sacrifices which lead to successful outcomes.
Our cities are well rehearsed to handle the weather, whereas the Texas Department of Transportation lacks the physical equipment to plow off the half a foot of snow from the roadways. Formal government and its preparedness are just one feature of the ability of a community to identify, communicate and respond to the challenges, or ambitions, at hand. But it’s really the coordination abilities of the whole group which delineates its capacity.
Some words or phrases latch onto you like thistles while walking through blooming prairie grasses. They tag onto your pant leg until you notice them and pluck them off for a closer look. Labor wedge has such a nice visual, a separation between what a model is predicting and the empirical data, I think that’s how it wedged its way into my thoughts.
It seems to be a fairly new macroeconomic term, defined at the start of a paper by Loukas Karabarbounis, University of Chicago, as:
Do fluctuations of the labor wedge, defined as the gap between the firm’s marginal product of labor (MPN) and the household’s marginal rate of substitution (MRS), reflect fluctuations of the gap between the MPN and the real wage or fluctuations of the gap between the real wage and the MRS? For many countries and most forcefully for the United States, fluctuations of the labor wedge predominantly reflect fluctuations of the gap between the real wage and the MRS.
At different time periods, American households have found it advantageous to substitute out paid work for something else. They preferred to spend their time, perhaps at home, performing valued activities for their families. Or perhaps the value was found in associational life of another nature. De Tocqueville said years ago that Americans are apt at associational life.
More interesting are the measuring questions. How do we categorize where people have the opportunity to perform duties which build capital for themselves and, most probably, their communities? Where are they exerting energies in lieu of showing up for a paycheck?
Sorting by their economic benefit seems sensible. If the ambitions fall under health related activities (staying out of the workforce to care for an aging parent) then the credit goes to pubic health. If education (during these Covid times people are staying out the workforce to supervise their children’s education) is the goal then shuffle those hours to the public education column of the ledger. If governance (people are choosing to spend their time on park boards or citizen commissions instead of working) is where the hours are spent, then register the tally under civics, and so on.
A better understanding of these motives and ventures will smooth out the prickly problem of labor wedges.
Lots of folks are speculating about what the world will look like once people emerge from the Covid induced hibernation. Zoom, Teams and other internet mediums have shown how it is possible to run companies and services remotely. But will people use this flexible employment opportunity and choose to live elsewhere?
One way to consider this is to look at why people moved before Covid-19. Porch.com is a home remodeling site and tracks this information. On average people relocate every seven years, and people don’t take it lightly. As Porch explains:
Moving is a hassle. From boxing up one home to finding another, facing a move can feel like scaling Mount Everest. Itโs no wonder Americans have been moving at decreasing rates since the 1980s. In fact, the moving rate in America reached its lowest in 2018 since 1948, when the U.S. Census Bureau began tracking moving rates.
Buyers diligently write out a list of wants and needs when they start their home search. Some of these criteria change of the course of evaluating all the amenities that different areas have to offer. One in four (on Porch’s sample of 1000) said that more space was the greatest driver for a move. Realtor Magazine broke the other reasons down by percentages:
Desire for a larger home: 26%
Desire to own, not rent: 19%
Downsizing: 12%
New job or job transfer: 11%
Desire for a better neighborhood: 9%
Separating from a significant other: 6%
Establishing own household (e.g. moved out of parentsโ house): 6%
Desire to be closer to family: 5%
Desire for a shorter commute: 5%
Only 5 percent (said) they made a decision based on commute times. A job relocation prompts a greater response. Still–few buyers consider distance from employment as a significant determinant. Perhaps we should consider how many types of jobs are really affected by the ability to dial-in from a home office?
Anyone involved in the construction or maintenance of built structures (plumbers, sheet-rocker, bull doze drivers, HVAC contractors) will always drive to job sites. Then you have all the service providers who interact face-to-face and hence are tied to location such as k-12 school teachers and administrators, nurses and hospital staff, lab workers. People who build stuff like workers in a production plant are also anchored by their workplace location.
That leaves white collar jobs such as attorneys, accountants, mortgage underwriters, IT workers, architects, engineers and actuaries. Many of these jobs have already provided opportunities for their workers to work remotely. And as some of these jobs grow to include management and partnership opportunities, it is less clear that the full-time remote option would be available. A transition to more of a business ownership role would require better proximity to clients and/or employees.
I speculate that remote work won’t send homeowners off to new locations as much as their home’s floor plan. With more time spent at home, the functionality of their living space comes sharply into focus. Many will decide they need more space. Or it maybe the issue of how the space is distributed. An accountant might be fine with spending one day a week wedged in a cinder block space in the basement laundry room of a 50’s rambler, but becoming a full-time home office worker will demand a more comfortable office with appropriate buffers from family life.
This should make We Work types of built-place solutions more popular, especially in neighborhoods with smaller homes which are more difficult to expand due to limited lot sizes. Suburban neighborhoods may have more elbow room, but residents here may feel overwhelmed with the increased together-time. Whereas suburbanites used to enjoy their anonymity, perhaps this will diminish when a bunch of them no longer depart to their other lives across town. Those who seek the old sense of distance and privacy may shift out to the third tier suburbs and beyond.
Maybe the post-Covid environment won’t be about people moving away from their present communities as much as employers reaching across the country into a larger pool of talent. There will be community upsides to more folks working from home as well. Keeping people out of cars and airplanes will give back more time for family work, free up roads from congestion, and reduce pollution. Overall the great work-from-home experiment of 2020 will contribute to increased productivity in both the private and public spheres.
That’s the election news from Austin, Texas. A pretty hefty purchase for a metro of 2.2 million people. More on the deets from the local Patch:
The project came in two separate parts for voters, Proposition A and Proposition B โ both of which gained support from the majority of registered voters. The former, which passed with 59 percent of the vote, calls for an 8.75-cent increase per $100 valuation to the city’s property tax rate, resulting in around a 4 percent increase to the total bill, toward a high-capacity transit system known as Project Connect. Prop B, which passed with 68 percent of the vote, provides for $460 million in debt issuance toward transportation improvements โsidewalks, bikeways, urban trails, safety projects and the like.
This wasn’t the first run at a rail transportation package in the capital of Texas. It wasn’t for lack of need. The urban’s center’s population growth for the decade ending in 2018 was 37%. Yet two prior funding attempts had failed. This time things were different.
โThere were three main arguments that were made,โ says Austin mayor Steve Adler. โOne was congestion. One was climate change. One was mobility equity in our city.โ
This time the city was all in. The focus was not only on light rail to improve commute times and to connect various parts of the city, goals which appeal to those who could better use the hour from a daily commute, and to those who prioritize emission reduction. But the plan also provides for “transportation infrastructure including sidewalks, transportation-related bikeways, urban trails, transportation safety projects (Vision Zero), safe routes to school and substandard streets.”
Let’s count the public objectives: transit, health, environment, access to jobs, recreation, safety. And lest you think they forgot about housing:
The plan, funded by an increase in property taxes, also includes $300 million to help make sure that as transportation improves in some neighborhoods and housing values rise, residents arenโt displaced from their homes due to gentrification. Theyโll do this by offering rent subsidies, building more affordable housing, and giving financial assistance to home buyers.
Austin’s business success and hence population boom has put it in the enviable position of having a need for all these public projects as well as the financial ability to fund them, which they have tied directly to the assessed values of real estate.
But what about cities that just need one of those amenities, or even just a leg of light rail, or upgrades to a suite of bridges, or replacement of a water treatment facility? What are the standard pricing mechanisms and what are they tied back to in such a way that is financially acceptable to all those who support the improvement? What are the combinations that upsell a project and close the deal, such as this one in Austin?
Minnesota passed a 1.87 billion bonding at the fifth special session held in 2020. Two years of touring and evaluating worthy projects, and still the delays and posturing and addon’s. The beauty of a standardized pricing mechanism is that the crazy haggling is reduced to more amenable swings. And more importantly people don’t feel the hazy disbelief that I did when I walked away from a souk off the central square in Marrakesh after paying $20 for two sad sticks of incense.
Saint Helena hangs in the Atlantic between the eastern reaches of South America and the west shores of Africa.
It is one of the most isolated islands in the world and was uninhabited when discovered by the Portuguese in 1502. It was an important stopover for ships sailing to Europe from Asia and Southern Africa for centuries.
A five day ferry ride from Cape Town takes Napoleon buffs to his final resting place on the island. See more great photos from The Atlantic.
In the is-it-private-or-is-it-public game, I agree that a home is a private good. The event which makes you a home owner is a closing, which in Minnesota, is usually held at a title company. On the chosen day the buyers and sellers sit down (pre-Covid) and the buyers sign up for a mortgage to finance the purchase while the sellers sign over a warranty deed. Done deal. No take-backs. The fees include a little state tax and filing fees so the documents are filed publicly in the county recorders office.
The process almost seems trivial but it so powerful. This singing over of a title and its public recording in a government office is the most significant feature of private wealth in the US system.
Interestingly, there are a whole assortment of local norms and customs revolving around closings across the United States. Most states either close at the table or over an escrow period. In Wyoming, however, real estate agents conduct the closings. Also specified and unique to almost every state is a foreclosure process. Most weigh heavily on consumer protection. And here is an interesting table breaking down all the nit picky processes and fees.
Owning a home is a staple of the American dream. Owning a home ties you to a community where you participate in measure of all public venues: public safety, pubic schools, public transportation, parks trails and the environment, governance and civic pride.
When trying to understand why some goods and services are provided in the private sphere versus the public sphere, let’s consider the history of the Hennepin Ave Bridge. Back when Minnesota was just a territory, full of trappers and prospectors and a military force down the river at Fort Snelling, two entrepreneurs took it upon themselves to get folks across the mighty Mississippi. From MNopedia:
In 1847 businessman Franklin Steele and his friend John Stevens established a rope ferry from Nicollet Island to the western side of the river to help travelers cross.
While the ferry helped initially, an increase in traffic necessitated new construction. In 1851 a bridge was built from St. Anthony to Nicollet Island to make the trek to the island easier for travelers. A short time later Steele and local business leaders took steps to build a bridge that would reach both sides of the river.
On March 4, 1852, Steele and his associates were granted a charter by the Territorial Legislature to build a bridge. The group formed the Mississippi Bridge Company and soon after began planning for a new bridge along the same path as the rope ferry.
The bridge opened to the public in January of 1855. The business partnership of Steele and Stevens charged a toll of 3 cents to the 1450 residents on both sides of the banks to alleviate their $36,000 investment. But there were problems.
The bridge was almost immediately plagued with safety issues. On March 25, 1855, a tornado tore through the area, nearly destroying the bridge. Although it was rebuilt and reopened on July 4, safety and capacity concerns persisted throughout its lifetime that eventually led to its being replaced.
After 14 years, the bridge changed ownership from private to public ownership.
In 1869 the charter the Mississippi Bridge Company held on the bridge expired and Hennepin County paid the company $37,500 to assume ownership. The toll requirement continued until the bonds sold to buy the bridge were paid off in 1872.
This bridge, as well as all other highways and bridges in the state, continue to operate as part of a public transportation infrastructure system. Why some products are deemed private and some are public is a topic this blog will continue to explore. Products and services that meet the demands of numerous groups, whether business groups, family groups, associational groups and so on, in conjunction with a need for some measure of public safety seem better suited to the public sphere.
The Metropolitan Council was conceived a little over fifty years ago with the foresight that the Twin City Metropolitan Area of Minneapolis and St. Paul would benefit from a multi-county planning entity. Large infrastructure projects like transit and water/sewer in particular would be best coordinated regionally in lieu of by an aggregation of cities. The 17 member council serves at the pleasure of the sitting governor. Here is a nice fact sheet providing an overview of the council’s latest accomplishments.
The council wields a tremendous amount of power for an unelected body. Over the years objections to this structure have been voiced by champions of both the left and the right. But for the time being, it is a structure which continues to influence the growth of residential settlement through patterns of transportation provided by bus and light rail, and through the provision of city and water.
In a presentation last week, Charlie Zelle, the chair of the council stressed that his agency is responsible for planning. In light of this spirit, I would like to propose a new way to frame up some of the research.
There are two new infrastructure projects which will offer circulation options for residents. First off, a new interchange off interstate I94 will provide direct access to the city of Dayton, a third tier suburb. Dayton, with a population of 6,302, was bypassed for development and become donut hole to suburban expansion while the populations of neighboring communities grew: Maple Grove to 71k, Champlin to 25k and Rogers to the NW to 13K. The mayor of Dayton touts the economic potential that will be unlocked by the anticipated increase in vehicle traffic from the off ramp.
The second infrastructure project is the Southwest Light Rail which recently received its Full Funding Grant Agreement from the Federal Transit Administration. This transit option links the four SW suburbs of St. Louis Park, Hopkins, Minnetonka, and Eden Prairie to the City of Minneapolis.
Excitement around Southwest LRT in not just confined to transportation advocates, already the alignment has seen hundreds of millions of dollars of private investments along the line. From affordable housing to commercial centers, Southwest LRT is making an impact on the stateโs economy a trend which will continue far into the future.
Both of these projects will allow a new pattern of circulation for residents. One will experience growth and transformation from rural low density to suburban. The other will allow a built community to circulate more readily to and from the downtown core.
Whereas commuters and businesses are often the focus of the benefits to transit, I would be interested in seeing how all pubic goods in these communities fare following the completion of these two projects. Are there effects to public safety? Are the public schools over-loaded or better-funded? Are people healthier due to better access to medical care?
Maybe part of the concern regarding representation within the Metropolitan Council is for this reason; for the need to voice both the positive and negative impacts of transit and water/sewer infrastructure (restrictions) on the suite of public goods underwritten by a city. Elected officials, especially mayors, manage a boutique of goods for their residents, and they are not seeing the Council take all of them into consideration