The error of price-to-income-

The comparison of home prices to buyers’ incomes is a popular measure for assessing the health of the real estate market. Presently, that multiple seems high, and people are using it to cry, crisis! But is this true?

Amy Nixon posts on Twitter (now known as X):

All of economics is supply and demand.

The median household to median income argument makes sense only in an economy where we have built enough housing units per capita, and every housing unit is being allocated as a family shelter unit because it serves no other economic utility

The model breaks down when you have wealthy families buying 3-4 spare vacation homes. And mom and pop landlords hanging onto starter homes when they upsize. And institutions buying millions of single family homes. And single people living alone in two units instead of coupling to buy one unit. And foreign citizens buying homes. And people buying and using 2 million single family homes as hotels (Airbnbs)

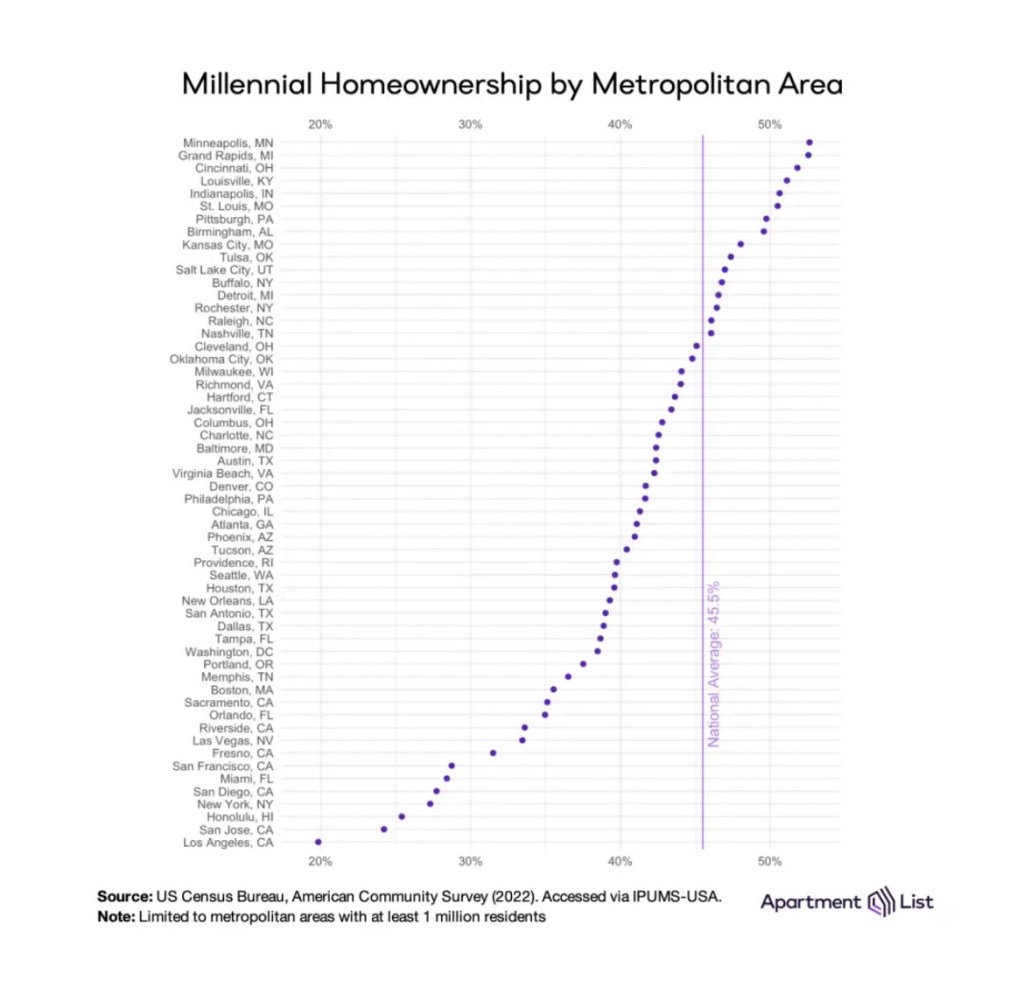
So long as single family residential housing is viewed as and can be used as an investment or luxury item beyond owner-occupied shelter and we don’t build enough homes to offset all those other uses, the ratio pictured in the infographic below can (and will) go even higher over time

It’s not 1985. And it’s never going to be 1985 again.

What Amy says is that there is a mix of home-ownership types. If you are analyzing Lake Country, with many second homes, there will be a different price-to-income figure than if you consider a first-tier suburb built almost exclusively of starter homes. I like to call them platters. It’s the local eco-systems of properties that have interesting numbers. Averaging just smudges out all the details.

I’ll also note the shift in demographic mix. The number of first-time buyers is at an all-time low. From NAR:

WASHINGTON (November 4, 2025) – The share of first-time home buyers dropped to a record low of 21%, while the typical age of first-time buyers climbed to an all-time high of 40 years, according to the National Association of REALTORS®’ 2025 Profile of Home Buyers and Sellers. This annual survey of recent home buyers and sellers covers transactions between July 2024 and June 2025 and offers industry professionals, consumers, and policymakers detailed insights into homebuying and selling behavior.

Repeat buyers enter the market with equity. They do not need to take on as much debt relative to their income as first-time buyers do. Yet the sales price is the measure from which payment is extrapolated, not the actual payment. As a market rises, so does the equity, pushing this fictitious measure of debt load out of whack with reality.

The cost of uncertainty

I showed a house this week in a modest but well-situated neighborhood. It had some problems, but mostly superficial– carpet, paint, appliances, and the like. Yet, even at a price below the comparable sales, it remains on the market. What? Uncertainty.

The property has been through a foreclosure, and as the tax records show, the bank holding the paper, Midfirst Bank, repurchased it. But this is a murky ownership situation.

At a sheriff’s sale, the buyer is not immediately given a full and clear ownership title the way they would in a normal real estate closing. Instead, the buyer typically receives one of two legal instruments depending on the state:

  1. Sheriff’s Certificate of Sale (common in states like Minnesota)
    • This document shows that the buyer purchased the property at the sheriff’s sale.
    • It is not a deed and does not yet transfer full title.
    • The original owner still has a redemption period (often 6–12 months, depending on the type of property and state law) to pay off the debt and reclaim the property.
  2. Sheriff’s Deed
    • If the redemption period expires without the former owner redeeming the property, the sheriff’s certificate is converted into a sheriff’s deed (sometimes automatically, sometimes requiring a filing).
    • The sheriff’s deed conveys whatever interest the debtor had in the property to the buyer, but it usually comes without warranties of clear title. That means the buyer takes the property subject to existing liens, unpaid taxes, or other encumbrances, unless state law says otherwise.

The property is being marketed by the owner who went through foreclosure, even though their right to the property is only through redemption. They would have to find a buyer to settle the full amount owed to Midfirst. This middle-ground ownership area makes the market uneasy. What if the bank wants more than the sheriff’s sale for fees and expenses? What if the property’s condition deteriorates between the offer and closing? Who will handle the repair? Will the title transfer be handled properly in the end?

Minnesota’s foreclosure rate is very low at one-half of one percent of the housing stock. So these sales are rare, and an investor will undoubtedly find it worthwhile to take on as a project. But in areas with insecure property rights and poor banking relations, the surcharge for uncertainty carries a hefty surcharge.

Ownership Preferred

Lists are fun, especially when your team is ranked at the top of the list. In this case, Apartment List pulled data from the Census to show that homeownership is the highest amongst Millennials in our area. Over 50 percent of folks in the 29-44 age range choose to own their homes rather than rent them.

Apartment List

Many will say that this is about price, as residents in San Jose and LA —cities at the bottom of the list —don’t own homes due to the high prices. And that’s a broad stroke, likely to be true, observation. But the list is long, and there are many other cities between the two extremes. So what else makes for a culture of ownership?

I’ve worked with some first-time buyers who don’t end up buying, and this is what seems to play on their minds. They are afraid they will lose the house in foreclosure. Someone close to them, perhaps even more than one, lost a home to creditors, and the negative experience frightens them. Second, they are afraid they will buy a lemon. Homes are complex, comprising many components. It’s easy to feel overwhelmed with the responsibility of keeping it all running smoothly. Lastly, they are afraid of adversarial neighbors.

Here’s a further breakdown of homeownership rates amongst all age groups in Minnesota.

MN Homeownership Report

I speculate that the last group has a homeownership rate of 77% because of the following factors. Low foreclosure rates keep the negative and traumatic experience of losing a home out of people’s lives. Since many residents grew up in owner-occupied households and experienced the ups and downs of repairs throughout their lives. They also have these folks in their lives to turn to for guidance. If the buyer has lived locally for most of their lives, they gravitate toward areas where they find the family and friends.

Minnesota rarely experiences the dramatic price swings that are more frequent in the coastal states. Hence, real estate tends to be a stable and reliable source of equity. People buy for pride of ownership and independence as well as frugality.

Housing needs and prices vary

The US Census has a new look. The site has improved tremendously. This might be old news, but it’s news to me. It’s worth checking out if you haven’t been there in a while. I particularly like the profile pages, like this one.

Take note of the breakdown of housing units and households. There are approximately 5.7% more housing units than households in the state. You need some vacancies as there are units under renovation or being held while a family relocates from one living situation to another. Is 5.7% in the comfortable range? It’s hard to know. Still– comparing the spread between households and units is a measure to determine how many extra spaces, if any, there are for families to live.

The county-level profiles are great too and come in several formats. Here are three to compare.

Each county has a different spread between the number of housing units and the number of households. The range is from 7% vacancy in the agricultural area of Blue Earth to a low of 1.8% in the most densely populated Hennepin County to a generous 16% in the northern lakes area of Mille Lacs County. Hennepin County is the only place we can say with certainty that there is a clear need for more housing.

Counties are large. There may be vacant structures in rural Blue Earth county while the demand for places to live is in Mankato, a nice-sized town of forty-five thousand. For that reason, it’s great that the Census even zooms into the city level.

Here’s a snapshot of Perham, a small but humming town about an hour SE of Fargo.

The point here is that housing is local. When people observe that the price of housing did not come down when new units were added, the follow-up question should be, what type of housing and where?

Crisis?

Crisis [ˈkrīsəs], noun, a time of intense difficulty, trouble, or danger.

Let’s consider a few housing facts to see if the state of our housing needs rise to that level in MN:

  • According to the US Census, Minnesota’s homeownership rate has hovered between 72% and 76% in the last four years. This is well above the national homeownership rate of 65%.
  • Minnesota’s foreclosure rate is down 9% from last year and ranks 27th nationwide with 370 homes in foreclosure or 1 out of 6,740. (Attomdata)

It seems that many Minnesotans can afford to own homes. Few are having difficulty maintaining their ownership positions. Crisis of homeownership averted in the far north.

That’s not to say that there may be housing issues for non-homeowners. Princeton University tracks evictions. Minnesota is third from the bottom on their list, at 4%. So renters don’t seem abnormally stressed or in crisis.

For those undergoing foreclosure or eviction, there is a crisis. Thus, they should receive the appropriate support to help them navigate their way to a solution to reestablishing shelter.

There is a crisis. It’s a crisis of wasteful regulation. So, call that out and make efforts for reform where needed.