People speculate why young people have delayed home purchases. Only around 20% of home purchases fall in this category. A historic low. But is it that surprising? Look at the surge of foreclosures in ’07-’08 and ’09. Hundreds of thousands of people who were never meant to have financial struggles lost their homes.
Children ages 8-12, old enough to sense the stresses within their families, yet too young to analyze the impact of a national financial crisis, were bystanders to these unpleasant legal actions in the early 2000’s. These are today’s young home buyers. Uncertain of what a real estate purchase will do for them. The anxiety associated with foreclosures has often been portrayed in litterature.
In Death of a Salesman, the family’s fear of losing their home emerges gradually, revealed not through a dramatic announcement but through Linda’s quiet confession that they are barely keeping up with the mortgage. She tells Biff and Happy that Willy has been borrowing money just to make the house payments—a disclosure that reframes the entire domestic landscape. What had seemed like an ordinary family home is suddenly understood as something fragile, held together by secrecy and strain.
The looming threat of foreclosure exposes the play’s deepest emotional fractures. The mortgage becomes a symbol of Willy’s unraveling identity—his failure as a provider and his desperate clinging to the American Dream. Linda’s hushed explanations carry a mournful tenderness, showing how fear and loyalty tangle together under financial pressure. For Willy, the house is both sanctuary and burden, and the possibility of losing it turns that symbol of pride into a reminder of collapse. The family’s anxiety over the home’s instability reveals how economic pressure corrodes affection, pride, and hope, tightening around them until it shapes every gesture they make toward one another.
The comparison of home prices to buyers’ incomes is a popular measure for assessing the health of the real estate market. Presently, that multiple seems high, and people are using it to cry, crisis! But is this true?
Amy Nixon posts on Twitter (now known as X):
All of economics is supply and demand.
The median household to median income argument makes sense only in an economy where we have built enough housing units per capita, and every housing unit is being allocated as a family shelter unit because it serves no other economic utility
The model breaks down when you have wealthy families buying 3-4 spare vacation homes. And mom and pop landlords hanging onto starter homes when they upsize. And institutions buying millions of single family homes. And single people living alone in two units instead of coupling to buy one unit. And foreign citizens buying homes. And people buying and using 2 million single family homes as hotels (Airbnbs)
So long as single family residential housing is viewed as and can be used as an investment or luxury item beyond owner-occupied shelter and we don’t build enough homes to offset all those other uses, the ratio pictured in the infographic below can (and will) go even higher over time
It’s not 1985. And it’s never going to be 1985 again.
What Amy says is that there is a mix of home-ownership types. If you are analyzing Lake Country, with many second homes, there will be a different price-to-income figure than if you consider a first-tier suburb built almost exclusively of starter homes. I like to call them platters. It’s the local eco-systems of properties that have interesting numbers. Averaging just smudges out all the details.
I’ll also note the shift in demographic mix. The number of first-time buyers is at an all-time low. From NAR:
WASHINGTON (November 4, 2025) – The share of first-time home buyers dropped to a record low of 21%, while the typical age of first-time buyers climbed to an all-time high of 40 years, according to the National Association of REALTORS®’ 2025 Profile of Home Buyers and Sellers. This annual survey of recent home buyers and sellers covers transactions between July 2024 and June 2025 and offers industry professionals, consumers, and policymakers detailed insights into homebuying and selling behavior.
Repeat buyers enter the market with equity. They do not need to take on as much debt relative to their income as first-time buyers do. Yet the sales price is the measure from which payment is extrapolated, not the actual payment. As a market rises, so does the equity, pushing this fictitious measure of debt load out of whack with reality.
There is no blob of “government” money, or “policy” that can make something affordable for one without making something else less affordable for another.
So if tenants get immediate relief from a rent freeze, where does that money come from?
Those outside the business may think that this will trigger a direct transfer from a wealthy landowner. Structurally this is an impractical notion. Even for those who have equity, it is just that: wealth tied up in the value of the property. It is not cash that can circulate and pay bills.
But in most all cases, the funds that come in from rent are pegged to go out to another obligation. This might be property taxes which are known to increase every year. This might be to a bank that financed the purchase of the property. And the insurance company which provides property isurance as required. This might be to a utility company. Each of these obligations have recourse for non-payment which ultimately leads to their making first claims on the income.
The funds which subsidize the rent freeze are most likely to come from monies intended for repairs and maintenance of the property. These vary from tasks that are good to do but not urgent, to things that if defrayed cause additional costs, to things that need immediate attention like a leaky pipe or a furnace outage. To give an idea of the number of routine items involved in the care of real estate, consider this post.
Over time, two things tend to occur. First, the new landlords with all their positive energy and desires to get ahead can’t maintain a financial foothold and leave. Other longer term owners prioritizes the most important fixes but let the cosemetic upgrades go. Over time more and more of the longer term components age, yards get overgrown, appliances become run down. The housing stock deteriorates.
The neighborhood at large is depreciated by blight, taking a little chunk of equity from every property owner nearby.
The biggest losers of rent control are the young, the mobile, the ambitious, immigrants, and people without a lot of cash. If you want to move from Fresno to take a job in San Francisco and move up, and you don’t have millions lying around to buy, you need rentals. Rent control means they are not available. Income inequality, opportunity, equity, all get worse.
In this paragraph, John Cochrane begins to draw lines around groups of people who will lose out under a rent-control, a policy that favors those who have established leases with landlords.
The reader can quickly imagine a young person being squeezed out of houisng by the combination of entry-level pay and bulked-up rent. The surcharge is necessary to balance out the rent-controled units. That’s the persona that comes to mind and it is the one the author intends to convey. But wait. What about the just-out-of-school coders and engineers that are swooped up by the tech companies?
These kids are paid a lot money. They are can choose where to live without much concern as, most often, they have no other attachments. They all live together in some big tech hub, often times leaving their childhood communties behind. They no longer have other points of reference like a brother who took up plumbing, or grandparents on fixed income. Not only do the have the cash flow to spend they are not being reminded that others do not.
One descriptor is not enough to form a group. To say the population of Minnesota has remained constant is light on details. Susan Bower, the state demographer, explains some of the demographic breaks down in Eden Prairie, a SW suburb of the Twin Cities. At the presentation she notes the the state loses 5,000-10,000 people a year but it is made up through international immigration. In other words, the people who leave have no concerns regarding rent control are replaced by a group who are disadvantaged by rent control.
To be efficient, matching people in consideration of their stage in life with their housing needs is best. Policies which keep people in place or discourages them from moving up, moving closer to employment, moving to a stronger school district, moving closer to support systems and so on are detrimental.
The Grumpy Economist has another great post, this time about rent control. For those of us in real estate, it’s an irritating topic. The errors in the use of price controls are numerous. Using John Cochrane’s article as a road map might be interesting to illustrate this point. Let’s start with this paragraph.
Sure, “sharply rising rents and utility bills wreak havoc on family budgets,” if the families don’t follow the screaming market signal to move. (Which is not painless, for sure. Incentives never are.) But the money comes from somewhere. Rent controls and energy price caps wreak havoc on landlord end electric utility budgets. The money must come from somewhere.
The claim is that rents are rising sharply. The reader pictures a Scrooge-like figure pounding on the door of a cowering family of four, announcing a ‘sharp’ rent increase (extra dollar symbols for emphasis), while behind this embodiment of the typical landlord stands an eviction notice ready to be served. I’d love to see numbers to this effect. I challenge that the ‘sharp’ rent increases are occurring at lease renewals.
Large corporate landlords might have a set policy of annual increases, but they account for only 3-4% of proprietors. Landlords must juggle the cost-benefit of increasing rent. As 80% own and manage the units, they calculate the costs, time, and uncertainty of a new tenant. This is weighed against a 3% increase on $1,100 or $33/mo in additional income. Needless to say, many landlords will forego a rent increase to keep a good tenant.
These subtleties are lost in real estate analysis, where all the numbers are averaged as if there were one typical renter, one typical landlord, and one typical property. This couldn’t be further from the truth. There are whole economies of renter groups. There are students who will have negative income before they join the workforce; there are singles with high-fluting jobs and no other responsibilities; there are single parents; there are couples with kids in a city just for a bit; there are elderly on fixed income with low mobility; there are recently divorcees looking for a glamorous downtown lifestyle.
Are all these groups to receive the same treatment? The same concern for their monthly budgets?Rent controls are initiated at the city level. Every group of renters would receive the benefit of a market-restrained obligation. Is that the intention?
Landlords are also assumed to be a certain type. The persona has tremendous equity in their property, no debt, and other cash they are stashing like squirrels do with acorns in the fall. And certainly some landlords fit this description. But more likely than not, the landlord has a mortgage and obligations against their time. The new entrants to the field, those trying to get ahead by getting a foothold in real estate, are undoubtedly the ones who need to make the cash flow.
When property taxes, utilities, or the cost of hiring labor rise, a landlord has no way to respond until a lease comes up for renewal. Rent control tightens this squeeze, leaving property owners caught between increasing public demands funded through taxation and their limited ability to recover those costs through rent. The first to be pushed out are often the newcomers—the small, aspiring owners who bring fresh energy and ambition to the market, but lack the cushion to absorb sustained losses.
Lesson number one. Averaging is a mistake. Assuming there is only one type of each actor in this economic trade of money for lodging makes for an impossible conversation.
There aren’t many. There’s the ‘how to get rich in real estate’ type of literature, which is only vaguely helpful to those with no real estate experience and, in equal measure, misleading. There are books developed to help salespersons pass the required testing to obtain a real estate license. There’s material on all sorts of financial instruments used to finance property. But I’m not talking about that type of thing.
I’m talking about the manner in which real estate features in people’s lives.
Judith Martin, a former professor of geography at the University of Minnesota, wrote Past Choices/Present Landscapes: The Impact of Urban Renewal on the Twin Cities. This project spotlights some of the effects I like to talk about. It focuses on the massive slum-clearing and subsequent redevelopment of large sections of inner-city property. In hind site Martin points out:
Much has been written about the ideas and the implementation of the urban renewal program in the United States during the 1950s and 1960s. Most of this literature views urban renewal as a program that: (1) worked to the disadvantage of people most in need of improved housing -a great deal of substandard housing was removed, but a relatively small amount of low-income housing was constructed;(2) was a boondoggle for developers-they were able to acquire land inexpensively from city authorities, and often made large profits on the projects built on this publicly acquired land; and (3) focused on economic development issues C’let’s fix up downtown”) at the expense of housing and neighborhood concerns (Anderson 1964; Hartman 1964; Gans 1965).
Viewed in retrospect, much of this criticism is valid, but it does not tell the whole story. Critics have portrayed planners who developed and implemented urban renewal programs as heartless beasts who turned a deaf ear to the real needs of “the people.” But it is hard to see most renewal officials as greedy and profiteering, or as consciously trying to exercise their power over helpless city residents. There are, for example, no notable cases of renewal officials growing rich working on these programs. If anything, the views of those who implemented urban renewal programs in the Twin Cities and elsewhere can be considered somewhat naive. They assumed that renewal could be accomplished quickly, that private developers would clamor for the opportunity to build in available areas, and that the renewal process could be carried out with relatively few snags. None of these assumptions proved to be true.
Real estate is a tricky wicket. If people want to follow along, they need to, as Judith indicates, read the whole landscape and not cherry-pick a brief situation in the misty flow of time.
I showed a house this week in a modest but well-situated neighborhood. It had some problems, but mostly superficial– carpet, paint, appliances, and the like. Yet, even at a price below the comparable sales, it remains on the market. What? Uncertainty.
The property has been through a foreclosure, and as the tax records show, the bank holding the paper, Midfirst Bank, repurchased it. But this is a murky ownership situation.
At a sheriff’s sale, the buyer is not immediately given a full and clear ownership title the way they would in a normal real estate closing. Instead, the buyer typically receives one of two legal instruments depending on the state:
Sheriff’s Certificate of Sale (common in states like Minnesota)
This document shows that the buyer purchased the property at the sheriff’s sale.
It is not a deed and does not yet transfer full title.
The original owner still has a redemption period (often 6–12 months, depending on the type of property and state law) to pay off the debt and reclaim the property.
Sheriff’s Deed
If the redemption period expires without the former owner redeeming the property, the sheriff’s certificate is converted into a sheriff’s deed (sometimes automatically, sometimes requiring a filing).
The sheriff’s deed conveys whatever interest the debtor had in the property to the buyer, but it usually comes without warranties of clear title. That means the buyer takes the property subject to existing liens, unpaid taxes, or other encumbrances, unless state law says otherwise.
The property is being marketed by the owner who went through foreclosure, even though their right to the property is only through redemption. They would have to find a buyer to settle the full amount owed to Midfirst. This middle-ground ownership area makes the market uneasy. What if the bank wants more than the sheriff’s sale for fees and expenses? What if the property’s condition deteriorates between the offer and closing? Who will handle the repair? Will the title transfer be handled properly in the end?
Minnesota’s foreclosure rate is very low at one-half of one percent of the housing stock. So these sales are rare, and an investor will undoubtedly find it worthwhile to take on as a project. But in areas with insecure property rights and poor banking relations, the surcharge for uncertainty carries a hefty surcharge.
I flew into Missoula today and the Montana Airport is wrapping up a major multi-phase expansion that reshapes regional travel and brings broader economic shifts in its wake. Here are some of the details:
The Physical Build-Out
Total Cost: Over $110 million for the full terminal expansion.
What’s New: New gates, expanded baggage claim, rental car lanes, security upgrades, and room for new routes and carriers.
Who’s Paying: a combo of the Feds and private interests
Federal: More than $50 million in grants, mostly from the Bipartisan Infrastructure Law.
State & Local: Matched funds from the Missoula Economic Partnership, businesses, and banks—no local tax dollars used.
Recent Boost: A $6M federal grant (2024) will help complete the next terminal phase.
Skyward Travel Growth
Missoula set a passenger record in 2024: Over 1 million flyers, up nearly 12% from the year before.
Targeting 1.5 million by 2044 as travel demand soars.
Now offering more frequent flights and year-round service to Chicago, thanks to an $875k federal grant.
The Ripple Effects
📚 University of Montana Perks
Easier access = stronger recruitment, research partnerships, and conference travel.
Out-of-state students now find Missoula more reachable and appealing.
🏘️ Housing Pressures
Expansion is fueling demand for housing, especially near the university and airport.
Rent hikes are real: Locals report steep increases, with “affordable” now starting near $1600/month.
Development impact fees (passed on to buyers) may also be contributing to rising costs.
💼 Local Economy
Jobs during construction and in airport operations.
Tourism boost: More flights mean more visitors spending at hotels, restaurants, and shops.
Stronger air links help regional business and health access.
🚧 Challenges Ahead
Affordability squeeze: Residents and students are feeling the pinch from rising rents.
Infrastructure stress: More travelers and new residents will test city roads, utilities, and services.
Equity concerns: Growth must be balanced to include long-term residents and low-income communities.
Final Approach
Missoula’s airport expansion is more than a construction project — it’s a gateway to growth. With smart federal funding and local vision, the region is positioning itself for a more connected future. But keeping Missoula livable as it grows will take coordination on housing, transportation, and community needs. How would one go about making some projections? Estimates of impacts and time frames could be interesting to local public leaders.
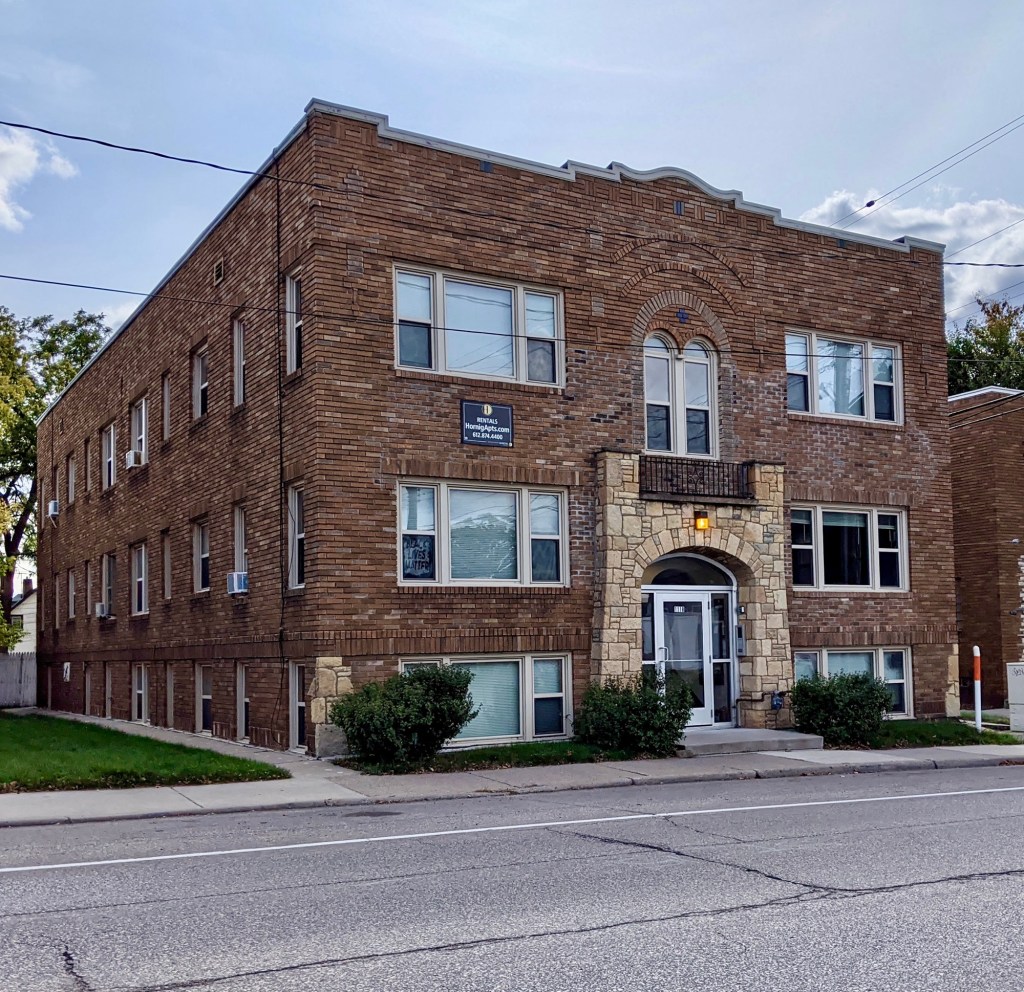
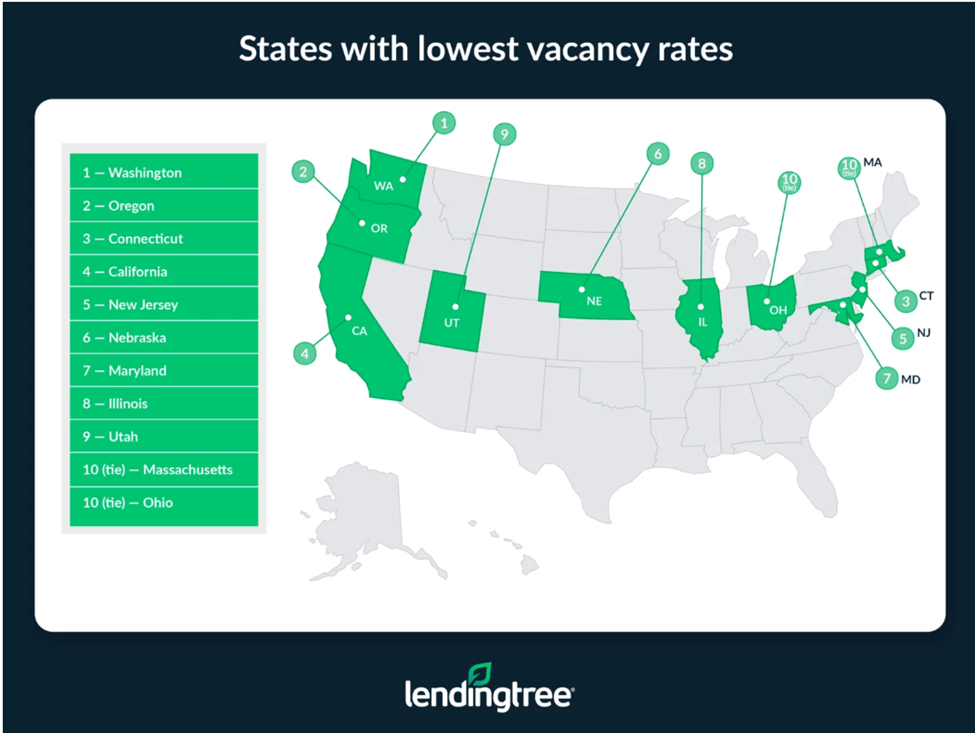
Some claim a housing crisis is underway, but I’m not so sure. If the pressure for homes were severe, one would expect most properties to be occupied, leaving others stranded without a place to go. Vacancy rates provide us with additional information. An article by LendingTree, 14.9 Million Homes Are Vacant in the US — Here Are the States With the Highest Vacancy Rates, provides a great overview of the topic.
Vacancy rates differ significantly depending on where you look in the country. If you’re looking at Maine, you’ll find the highest vacancy rate in the country — 21.09% (157,467 vacant homes), according to our analysis of the U.S. Census Bureau 2023 American Community Survey (ACS) with five-year estimates. Following Maine at the top is Vermont, with a 20.06% vacancy rate (67,606 vacant homes), and Alaska, with an 18.24% vacancy rate (59,745 vacant homes).
Together, these three states account for nearly 285,000 vacant homes — out of 14.9 million vacant homes nationwide.
Nationally, the vacancy rate is much lower than that of these three states, with the U.S. average sitting at 10.43% — a figure that translates into nearly 15 million vacant homes. While that may sound like a lot, it may not feel like it if you’re searching for a place to live. That’s because not all of those properties are available to rent or buy.
In addition to seasonal and vacation homes, others are classified as vacant because they’re in transition — those that are rented but not occupied and sold but not occupied. Homes for migrant workers, which they occupy during crop season, are also classified as vacant.
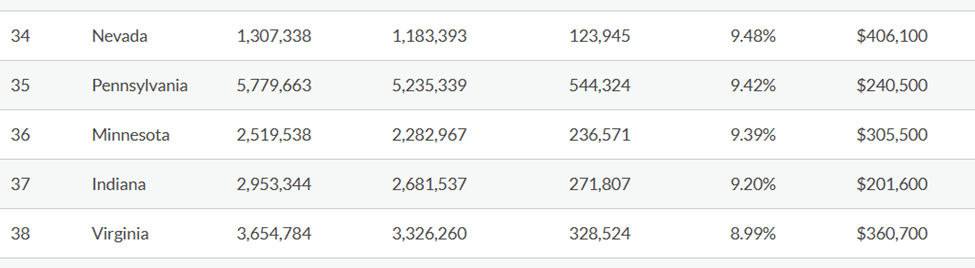
Minnesota, as is often the case, is just average. There are 236,571 homes vacant, which, in percentage terms, is 9.39%
The article cites a list of reasons why a home could be vacant. It might be a second home or vacation property. It might be in a transition state from either a remodel or a relocation of residents. Sometimes people hang onto properties for emotional reasons, such as a family tie to the land.
But note, in any case, that there is a variation between the states. Real estate is local. National generalizations about the state of housing are often dumbed down and not particularly helpful.
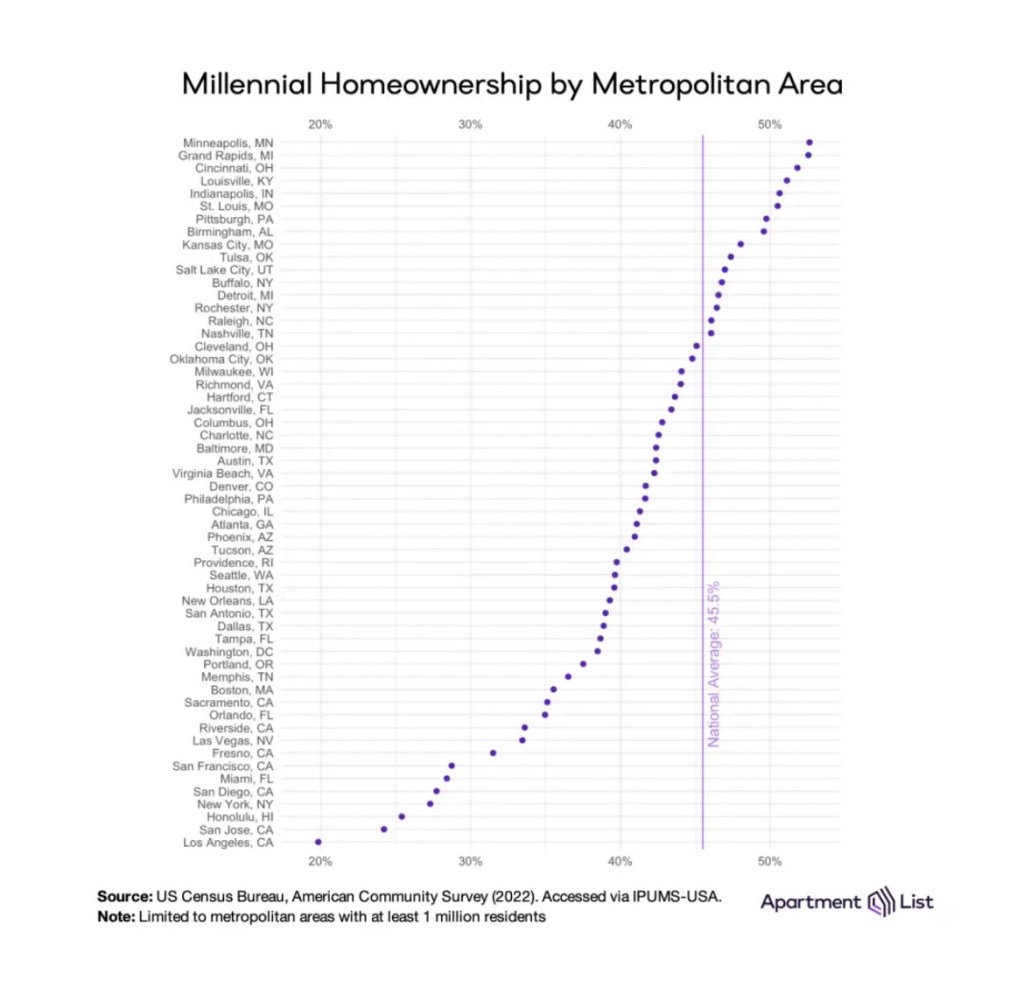
Lists are fun, especially when your team is ranked at the top of the list. In this case, Apartment List pulled data from the Census to show that homeownership is the highest amongst Millennials in our area. Over 50 percent of folks in the 29-44 age range choose to own their homes rather than rent them.
Many will say that this is about price, as residents in San Jose and LA —cities at the bottom of the list —don’t own homes due to the high prices. And that’s a broad stroke, likely to be true, observation. But the list is long, and there are many other cities between the two extremes. So what else makes for a culture of ownership?
I’ve worked with some first-time buyers who don’t end up buying, and this is what seems to play on their minds. They are afraid they will lose the house in foreclosure. Someone close to them, perhaps even more than one, lost a home to creditors, and the negative experience frightens them. Second, they are afraid they will buy a lemon. Homes are complex, comprising many components. It’s easy to feel overwhelmed with the responsibility of keeping it all running smoothly. Lastly, they are afraid of adversarial neighbors.
Here’s a further breakdown of homeownership rates amongst all age groups in Minnesota.
I speculate that the last group has a homeownership rate of 77% because of the following factors. Low foreclosure rates keep the negative and traumatic experience of losing a home out of people’s lives. Since many residents grew up in owner-occupied households and experienced the ups and downs of repairs throughout their lives. They also have these folks in their lives to turn to for guidance. If the buyer has lived locally for most of their lives, they gravitate toward areas where they find the family and friends.
Minnesota rarely experiences the dramatic price swings that are more frequent in the coastal states. Hence, real estate tends to be a stable and reliable source of equity. People buy for pride of ownership and independence as well as frugality.
I thought the US Census was a factual thing. It is meant to report data, not succumb to opinion. This headline, however, which is being used nationwide as a rally call against housing markets, is a product of capture.
The census people want us to believe that nearly half of renters are in financial straits.
How did they get this number, and why does it seem high when you look around in your life and don’t see that half of the people you know or come into contact with are shouldering the pressure of a cost-burdened housing expense? The threshold used to determine financial distress occurs when a household spends more than 30 percent of its income on housing expenses. It is said that this is an industry norm– meaning lenders of all stripes rely on this benchmark when determining creditworthiness.
That’s not to say that lenders do not approve borrowers with a higher debt-to-income level. They do. In fact, they will lend up to 50% in situational circumstances. Note that up to these levels, the financial institution is still anticipating that the loan will be repaid. Delinquencies are not the objective in the lending business. (Here’s a post on debt-to-income ratios from a few days ago.)
But that’s not what this headline implies. According to the census, 30-50% of the population is ‘burdened.’ Perhaps one could let that go to semantics. Only the ratio calculated in this case differs from the industry norm. This ratio includes utilities as a monthly expense, where the industry standard does not. So, how does the added cost of heating bills, electricity, water, and possibly internet (I’m not sure what the American Community Survey includes) adjust the threshold and push a larger share of the population over the 30% threshold?
The first thing to know is how a debt-to-income ratio is calculated. Take an average rental cost of $1300 a month. The monthly income amount for a 30% debt-to-income ratio is $4333/mo. If you add $139 in utility costs, everyone adjusts up 3%. An added monthly cost of $200 (say the respondent includes all their streaming options), then the debt-to-income ratio rounds up another cohort by 5%. It’s safe to say that the census is no longer using an industry standard by calculating ratios with additional monthly obligations.
Is the renter who likes streaming services cost-burdened or simply choosing an entertainment option? Is the renter who elects to pay a larger portion for rent to live on a metro line, forgo the cost of a car payment, and net out a lower monthly expense as a result, cost-burdened? Is the renter who selects a living option close enough to an ex-spouse to share custody and not pay child support cost burdened or cost savvy?
People arrange their monthly budgets all the time with savings and benefits that may not be readily apparent to the outside world. That’s the beauty of choice. As long as a market is loose enough for people to navigate to their best circumstances, they arrive at a combination that works in their best interest, reflecting all facets of their lives.
College students will undoubtedly pay more for rent than their income would seem to allow. That’s the reality of their stage of life. Seniors also fall into a different category of consumer than working adults. Many could be at a stage where their monthly living expenses may include food and care, while their monthly income may just be one source in their retirement plan for covering expenses at the end of life. Are these students octogenarians, cost-burdened, or simply living their lives as planned?
Affordability is a subjective measure. I question the Census’s objectives in publishing opinions on affordability in the housing markets. What’s next? Will we be told we can’t afford to take a vacation or to take the summer off to be with our kids? Or should the Census return to the way it was– a fact provider?
Often, the merits of a transaction are given from the perspective of a single agent in the trade. An assembly line-worker lost their job when the plant was moved to another location. This is bad. The worker suffered a loss. Quickly, within sentences, the effect is generalized to all the workers in the plant, town or even region. The Experience of the middle aged white guy who is difficult to retrain and find meaningful work of the same quality is the catalyst for all sorts of feelings and demands for government intervention.
Do you see the slide? From a valid totaling up of wins and losses for one individual turned into a model involving segments of society.
It’s important to declare which model is in play as this dictates whether the players are individuals or groups, whether the tally of net benefit or loss is assigned to one or to many, and perhaps most interestingly the flow of reaction and counterreaction as value settles in the system. More interesting insights surface when consequential outcomes are looked at in a flow of events.
Think back to the time of the 2008 recession. Say one buyer purchased a home at the peak of the housing market with a three-year adjustable ARM. When the ARM recalculated in 2011, the buyer’s payment adjusted upwards to an amount beyond their ability to pay. Due to the recession, the value of the home had decreased below the mortgage balance. The buyer ends up in a familiar situation at that time and loses the property to foreclosure. This is a clear loss.
But say every other homeowner in the neighborhood had owned their homes for more than ten years. None of them were interested in selling until after 2015. These individuals realized no impact from the value changes during the recession expcept to see their assessed values decline resulting in lower property taxes. As a neighborhood the effects of the recession were uneventful.
In the plant closure story, there were most probably workers who ended up better off for the closure. Perhaps it encouraged them to return to school to achieve an updated skill. At the other end of work life, perhaps someone nearing retirement ended up with a more favorable retirement package. Getting people to think of workers as a mass might be useful for unions, but loses a finess of obeservation for analysis.
It seems, to have a profitable discussion, one must pick a playing field. If you want to pick a town, then the players are all the workers, their economic impact on local services, and the support available through the municipality’s local services. Who netted out what and where did the money settle in time periods 1, 2, and 3 following a plant closure. If there was a draw of support from a higher level of governance, maybe the playing field needs to be moved up a rung to the county level, or to the region within the state. The players then get expanded to blend in other economic agents and their positive and negative tallies.
Instead, the story is usually told like some mid-19th century Russian novel. The peasants were persecuted and the capitalists must be blamed! This is not helpful.
On a trip to Manhattan a few years ago, my son and I noticed boarded-up store fronts along the best sidewalk shopping in the city. From the layers of flyers pasted on the brick wall and the thickness of dust perched on the window ledge, it was apparent that this state of disuse was a longterm thing. It didn’t make sense. What would make an owner prefer to leave a space empty instead of collecting rent from a desireable tenant looking for a desireable location?
If you were to think of this interms of a model, one might say, what are the negative implications of renting a storefront that zero out the benefit of incoming revenue from a tenant? What circumstances cause a property owner to be more interested in sitting on a vacant portion of a building rather than maximizing profit?
I say a portion of the building because the street level space of a NYC building is most always a small percentage of the entire building.
When an investor is looking to acquire new property there’s a lot of calculating to evaluate its prospects. The price of the building is mostly determined by how much cashflow the structure can generate. The lender (as in most cases there is financing involved) is also interested in the return their borrower will receive. This determines their comfort level in receiving payment on the debt.
With this in mind, a seller will often take action, prior to going on the market, to make the property attractive not only to the buyer but to all other parties involved in the transaction. For instance, an inspector will most probably make some rounds and look for mechanical flaws. The easy fixes are best done up front. Often there is a target renter in mind for the property and enhancement will be made to their structural preferences.
When a property goes for sale, there are lots of incentives to shine the place up and present it in its best light. Any salesperson will tell you this is how to generate the best offer.
Now fast forward twenty years, or thirty years, and the young investor with ambitions to build a portfolio has done exactly that. He or she is wealthy. There is a nice amount of equity in the property and the stress to recover every dollar in rent in order to pay the bank, the insurance company, the regulatory agencies and do repairs has eased. If the property is in a strong location, it is garnering a nice return year-in-year out. Often, it is better than other investments can offer.
Now, let’s consider the rental transaction for the storefront. It’s been a couple of decades since the property has had a full upgrade. Perhaps the paint is looking a little faded. Perhaps the interior tile work has more chips in the tile than some deem acceptable. A new younger set of folks want just that much more than what was available before. So for a bit more money in rent the owner is dealing with a lot more in either managing expectations or renovations. Renovations almost always means interacting with a regulatory entity as well. Once on the property, other issues may be brought to light.
There are two factors that go into the cost-benefit calculation of securing the lease. The rent received. And another important factor which we will call the engagement factor. When the owner takes on a new tenant they are agreeing to engage with their expectations, their payment and request idiosyncrasies. It’s not just the dollars. In the same way an insurance claim is not just about getting reimbursed for the repair work. You have to deal with the insurance rep, meet three contractors to get bids, and supervise the work. There’s an engagement factor. The street level activity also has an engagement factor. If the public has become more truant, than property damage or security issues create a cost on the owner’s time.
It gets to the point that the hastle of interacting with others starts to draw down the marginal benefit of the extra rent. Throw in a potential tax implication and that little benefit could shrink to almost nothing. An empty unit creates a tax write-off. A rented unit throws off income that is now taxed at higher rates, as many deductions have run their course.
The store fronts could be collecting dust because the engagement factors are simply too expensive.