People speculate why young people have delayed home purchases. Only around 20% of home purchases fall in this category. A historic low. But is it that surprising? Look at the surge of foreclosures in ’07-’08 and ’09. Hundreds of thousands of people who were never meant to have financial struggles lost their homes.
Children ages 8-12, old enough to sense the stresses within their families, yet too young to analyze the impact of a national financial crisis, were bystanders to these unpleasant legal actions in the early 2000’s. These are today’s young home buyers. Uncertain of what a real estate purchase will do for them. The anxiety associated with foreclosures has often been portrayed in litterature.
In Death of a Salesman, the family’s fear of losing their home emerges gradually, revealed not through a dramatic announcement but through Linda’s quiet confession that they are barely keeping up with the mortgage. She tells Biff and Happy that Willy has been borrowing money just to make the house payments—a disclosure that reframes the entire domestic landscape. What had seemed like an ordinary family home is suddenly understood as something fragile, held together by secrecy and strain.
The looming threat of foreclosure exposes the play’s deepest emotional fractures. The mortgage becomes a symbol of Willy’s unraveling identity—his failure as a provider and his desperate clinging to the American Dream. Linda’s hushed explanations carry a mournful tenderness, showing how fear and loyalty tangle together under financial pressure. For Willy, the house is both sanctuary and burden, and the possibility of losing it turns that symbol of pride into a reminder of collapse. The family’s anxiety over the home’s instability reveals how economic pressure corrodes affection, pride, and hope, tightening around them until it shapes every gesture they make toward one another.
There is no blob of “government” money, or “policy” that can make something affordable for one without making something else less affordable for another.
So if tenants get immediate relief from a rent freeze, where does that money come from?
Those outside the business may think that this will trigger a direct transfer from a wealthy landowner. Structurally this is an impractical notion. Even for those who have equity, it is just that: wealth tied up in the value of the property. It is not cash that can circulate and pay bills.
But in most all cases, the funds that come in from rent are pegged to go out to another obligation. This might be property taxes which are known to increase every year. This might be to a bank that financed the purchase of the property. And the insurance company which provides property isurance as required. This might be to a utility company. Each of these obligations have recourse for non-payment which ultimately leads to their making first claims on the income.
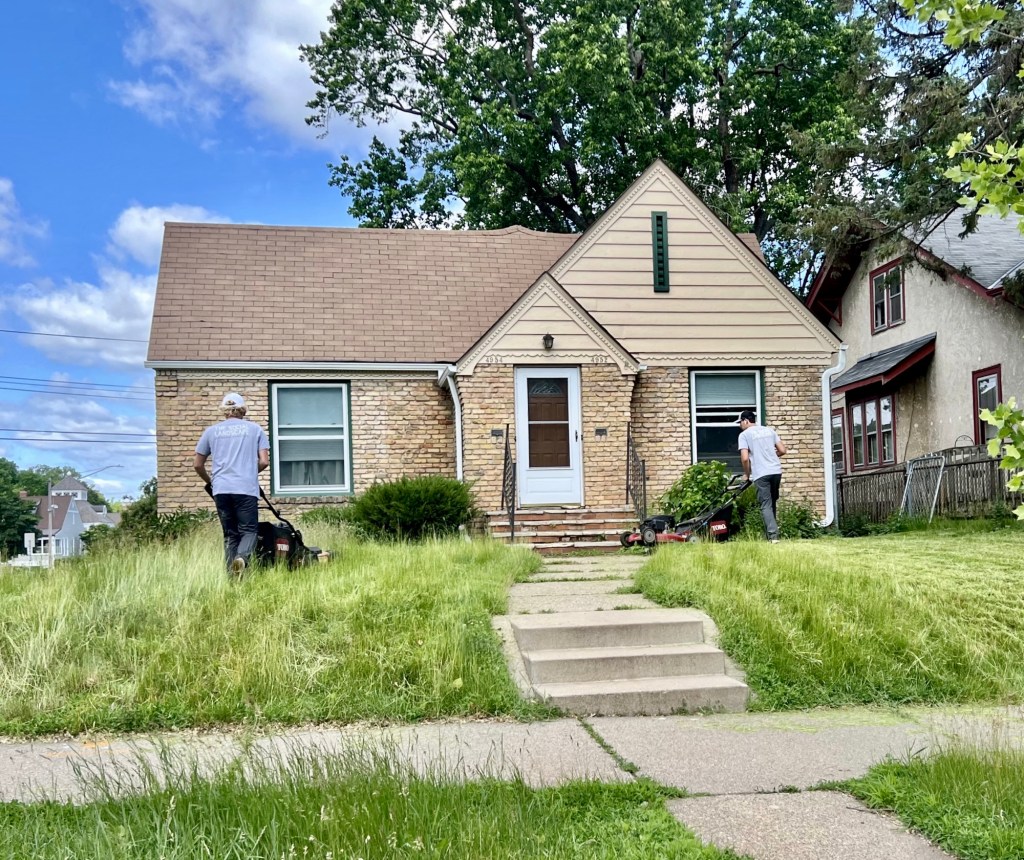
The funds which subsidize the rent freeze are most likely to come from monies intended for repairs and maintenance of the property. These vary from tasks that are good to do but not urgent, to things that if defrayed cause additional costs, to things that need immediate attention like a leaky pipe or a furnace outage. To give an idea of the number of routine items involved in the care of real estate, consider this post.
Over time, two things tend to occur. First, the new landlords with all their positive energy and desires to get ahead can’t maintain a financial foothold and leave. Other longer term owners prioritizes the most important fixes but let the cosemetic upgrades go. Over time more and more of the longer term components age, yards get overgrown, appliances become run down. The housing stock deteriorates.
The neighborhood at large is depreciated by blight, taking a little chunk of equity from every property owner nearby.
I showed a house this week in a modest but well-situated neighborhood. It had some problems, but mostly superficial– carpet, paint, appliances, and the like. Yet, even at a price below the comparable sales, it remains on the market. What? Uncertainty.
The property has been through a foreclosure, and as the tax records show, the bank holding the paper, Midfirst Bank, repurchased it. But this is a murky ownership situation.
At a sheriff’s sale, the buyer is not immediately given a full and clear ownership title the way they would in a normal real estate closing. Instead, the buyer typically receives one of two legal instruments depending on the state:
Sheriff’s Certificate of Sale (common in states like Minnesota)
This document shows that the buyer purchased the property at the sheriff’s sale.
It is not a deed and does not yet transfer full title.
The original owner still has a redemption period (often 6–12 months, depending on the type of property and state law) to pay off the debt and reclaim the property.
Sheriff’s Deed
If the redemption period expires without the former owner redeeming the property, the sheriff’s certificate is converted into a sheriff’s deed (sometimes automatically, sometimes requiring a filing).
The sheriff’s deed conveys whatever interest the debtor had in the property to the buyer, but it usually comes without warranties of clear title. That means the buyer takes the property subject to existing liens, unpaid taxes, or other encumbrances, unless state law says otherwise.
The property is being marketed by the owner who went through foreclosure, even though their right to the property is only through redemption. They would have to find a buyer to settle the full amount owed to Midfirst. This middle-ground ownership area makes the market uneasy. What if the bank wants more than the sheriff’s sale for fees and expenses? What if the property’s condition deteriorates between the offer and closing? Who will handle the repair? Will the title transfer be handled properly in the end?
Minnesota’s foreclosure rate is very low at one-half of one percent of the housing stock. So these sales are rare, and an investor will undoubtedly find it worthwhile to take on as a project. But in areas with insecure property rights and poor banking relations, the surcharge for uncertainty carries a hefty surcharge.
I thought the US Census was a factual thing. It is meant to report data, not succumb to opinion. This headline, however, which is being used nationwide as a rally call against housing markets, is a product of capture.
The census people want us to believe that nearly half of renters are in financial straits.
How did they get this number, and why does it seem high when you look around in your life and don’t see that half of the people you know or come into contact with are shouldering the pressure of a cost-burdened housing expense? The threshold used to determine financial distress occurs when a household spends more than 30 percent of its income on housing expenses. It is said that this is an industry norm– meaning lenders of all stripes rely on this benchmark when determining creditworthiness.
That’s not to say that lenders do not approve borrowers with a higher debt-to-income level. They do. In fact, they will lend up to 50% in situational circumstances. Note that up to these levels, the financial institution is still anticipating that the loan will be repaid. Delinquencies are not the objective in the lending business. (Here’s a post on debt-to-income ratios from a few days ago.)
But that’s not what this headline implies. According to the census, 30-50% of the population is ‘burdened.’ Perhaps one could let that go to semantics. Only the ratio calculated in this case differs from the industry norm. This ratio includes utilities as a monthly expense, where the industry standard does not. So, how does the added cost of heating bills, electricity, water, and possibly internet (I’m not sure what the American Community Survey includes) adjust the threshold and push a larger share of the population over the 30% threshold?
The first thing to know is how a debt-to-income ratio is calculated. Take an average rental cost of $1300 a month. The monthly income amount for a 30% debt-to-income ratio is $4333/mo. If you add $139 in utility costs, everyone adjusts up 3%. An added monthly cost of $200 (say the respondent includes all their streaming options), then the debt-to-income ratio rounds up another cohort by 5%. It’s safe to say that the census is no longer using an industry standard by calculating ratios with additional monthly obligations.
Is the renter who likes streaming services cost-burdened or simply choosing an entertainment option? Is the renter who elects to pay a larger portion for rent to live on a metro line, forgo the cost of a car payment, and net out a lower monthly expense as a result, cost-burdened? Is the renter who selects a living option close enough to an ex-spouse to share custody and not pay child support cost burdened or cost savvy?
People arrange their monthly budgets all the time with savings and benefits that may not be readily apparent to the outside world. That’s the beauty of choice. As long as a market is loose enough for people to navigate to their best circumstances, they arrive at a combination that works in their best interest, reflecting all facets of their lives.
College students will undoubtedly pay more for rent than their income would seem to allow. That’s the reality of their stage of life. Seniors also fall into a different category of consumer than working adults. Many could be at a stage where their monthly living expenses may include food and care, while their monthly income may just be one source in their retirement plan for covering expenses at the end of life. Are these students octogenarians, cost-burdened, or simply living their lives as planned?
Affordability is a subjective measure. I question the Census’s objectives in publishing opinions on affordability in the housing markets. What’s next? Will we be told we can’t afford to take a vacation or to take the summer off to be with our kids? Or should the Census return to the way it was– a fact provider?
In a recent paper co-written with researchers from the University of Wisconsin-Madison and the University of Illinois-Chicago and initially published by the Minneapolis Fed, we measured the evolution of housing quality for low-income households over the past several decades across the United States. We found broad and generally large increases in housing quality and smaller but still important increases in living space.
So, it’s not surprising that the data show fewer low-income people living in squalor.
I like this part too. It’s a great example of how headlines can suggest misleading information. Although gross rents have increase, they have hit people’s monthly budgets at a much lower increase.
As housing quality and quantity are getting better, how much more are households paying for it? According to the AHS, for below-median-income Twin Cities area residents, real monthly spending on housing increased by 32 percent from 1998 to 2021, from $1,008 to $1,333. Around half of below-median-income Twin Cities households remain housing-cost-burdened (spending 30 percent or more of their income on housing) and a quarter remain severely housing-cost-burdened (spending 50 percent or more of their income on housing). For many families that spend a large fraction of their income on housing, findings about general housing improvements may be tough to appreciate.
However, our analysis indicates that greater housing spending reflects not only higher housing prices but also Twin Cities area residents’ ability to afford housing that is larger and nicer. Overall, the average housing budget share only increased by 4 percentage points from 1998 to 2021, from 36 percent to 40 percent of income, which indicates that most of the growth in spending on housing is driven by higher incomes, better quality, and more spacious homes, as opposed to needing to allocate a greater share of income for the same, unimproved housing.
Some combination of private money, public efforts, and community involvement is improving living standards for those with lower incomes. And it’s not clear at all that the burden is falling on the most vulnerable.
Duncan Ironmonger, an Australian household economist, wrote in 2001.
3.2 The New Household Economics In the mid 1960s a major theoretical development took place, known as the “new household economics” (see Becker (1981), Ironmonger (1972) and Lancaster (1971). In this theory the household is regarded as a productive sector with household activities modeled as a series of industries. In this new approach, households produce commodities that are designed to satisfy separate wants such as thirst, hunger, warmth and shelter. The characteristics, or want-satisfying qualities, of the commodities used and produced can be regarded as defining the production and consumption technology of households. With changes in incomes and prices, households still alter expenditures as in the earlier theory. However, in the new theory, households adjust their behaviour as they discover new commodities and their usefulness in household production processes. The activities approach derived from the theory of the new household economics readily combines with the earlier input-output approach of Leontief (1941) to establish a series of household input-output tables as the framework for modeling household production.
And then this in conclusion.
6 Household Production and a World of Binary Economies
The major scientific achievement of this field has been the measurement of the magnitude of household production through surveys of the uses of time. Household production is now recognised as an alternative economy to the market; in many countries the household economy absorbs more labour and at least one third the physical capital used in the market economy.
In future, national statistical organisations will produce regular estimates of GHP. Data on outputs of household production – accommodation, meals, clean clothes and the care of children and adults – will complement data on inputs of unpaid labor and the use of household capital.
Proper recognition of the household economy will have arrived when national household accounts are published each quarter alongside national accounts for the market economy. These data will enable greater scientific research on the organisation of household production, the interactions with the market economy, the role of households in building human capital, on the effects of household technology and alternative social and economic policies on gender divisions of labor and on family welfare.
Crisis [ˈkrīsəs], noun, a time of intense difficulty, trouble, or danger.
Let’s consider a few housing facts to see if the state of our housing needs rise to that level in MN:
According to the US Census, Minnesota’s homeownership rate has hovered between 72% and 76% in the last four years. This is well above the national homeownership rate of 65%.
Minnesota’s foreclosure rate is down 9% from last year and ranks 27th nationwide with 370 homes in foreclosure or 1 out of 6,740. (Attomdata)
It seems that many Minnesotans can afford to own homes. Few are having difficulty maintaining their ownership positions. Crisis of homeownership averted in the far north.
That’s not to say that there may be housing issues for non-homeowners. Princeton University tracks evictions. Minnesota is third from the bottom on their list, at 4%. So renters don’t seem abnormally stressed or in crisis.
For those undergoing foreclosure or eviction, there is a crisis. Thus, they should receive the appropriate support to help them navigate their way to a solution to reestablishing shelter.
There is a crisis. It’s a crisis of wasteful regulation. So, call that out and make efforts for reform where needed.
It was a privilege to meet sociologist Viviana Zelizer yesterday. Our No Due Date book club read her 1994 book The Social Meaning of Money and we are fortunate to have an hour live with authors to discuss their work.
I think ChatGPT provides some interesting insights into her work:
Viviana Zelizer’s work suggests that the value of social relations is not simply an external force acting on price, nor is it strictly endogenous in the sense of being fully determined within the price mechanism itself. Instead, she argues that social relations and economic transactions are deeply interwoven in a way that both shapes and is shaped by the cultural and moral contexts surrounding them.
In her framework, Zelizer contends that social values and economic exchanges co-constitute one another. That is, social relations influence economic value and practices, but these exchanges also affect the nature of social relationships. For example, in “The Social Meaning of Money,” she demonstrates that people assign specific social meanings to money and earmark it for different purposes (like gifts or household expenses), which reinforces particular social relationships. The relational context affects how money is perceived and used, indicating that social and moral values are not external to money and price but integral to how people understand and navigate economic transactions.
Zelizer’s approach thus goes beyond a simple model of “external influence” or “endogenous value,” advocating instead for a relational view. She calls this the “relational work” perspective, emphasizing that people continuously create and manage the boundaries between social and economic life. Through this process, social norms and values both influence and are influenced by economic behavior, making them mutually constitutive rather than separable or one-directional forces.
The U.S. dollar has been the most widely used international currency since 1945.1 The dollar is the most traded currency on international financial markets, dollars comprise 60% of official reserves (i.e., foreign exchange reserves), and many traded goods, such as oil, are commonly invoiced in dollars. In addition to these commercial uses of the dollar and dollar-denominated assets, individuals in many parts of the world hold U.S. currency, i.e., paper money, both as a store of value and as a medium of exchange.2 This blog post3 explains the widespread use of U.S. currency and provides some simple, back-of-the-envelope calculations on the size of some of the benefits to Americans.
The rest of the world holds a great deal of U.S. currency, i.e., cash. Although the amount can’t be precisely tracked, the Federal Reserve Board of Governors recently estimated that foreigners held $950 billion in U.S. banknotes at the end of the first quarter of 2021, or about 45% of all Federal Reserve notes outstanding, including two-thirds of all $100 bills. Overall holdings of U.S. currency have grown rapidly, however, and overseas holdings of Federal Reserve notes would now be worth closer to $1.1 trillion if such holdings are still half of all U.S. currency.
As long as prices are ticker taping along with typical elan, most people are happy to know that the amount they would give for a good or service is agreed to spontaneously, but many others. Sure, people will complain when a touch of frost ruins the citrus crop in Florida, leading to higher prices for grapefruit, lemons, or oranges. Little fluctuations make the dinner table news but are not show-stoppers in the ever-churning commerce between vendors and consumers.
The vibe changes when a typhoon rolls into the Sunshine State. Proclamations against price gouging come from the political power at hand. Every four-by-eight piece of plywood is needed to cover glass windows. However, the market system is no longer viewed as the desirable mechanism for distribution. Profit at the hands of disaster makes people uncomfortable.
Insurance alleviates the restraints of fears for the suddenly disadvantaged. When a hail storm comes through, insurance replaces all damaged vehicles or roofs. No one cries, ” Price gouging!” Everything is all right as long as it’s on the insurance company’s tab. Insurance coverage didn’t take the repairs out of the market system, but it did change the size of the risk group.
This happened with masks during COVID. In the early days of the virus, state health departments were desperate to get masks for essential personnel. As the prices soared, administrators realized every state was bidding up the price from foreign suppliers. Changing the buyer group from the state to the federal level, tampered down the bids.
Disasters are shared concerns over more extensive groups of people. The market system is not in error; it just needs regrouping.
Often, the merits of a transaction are given from the perspective of a single agent in the trade. An assembly line-worker lost their job when the plant was moved to another location. This is bad. The worker suffered a loss. Quickly, within sentences, the effect is generalized to all the workers in the plant, town or even region. The Experience of the middle aged white guy who is difficult to retrain and find meaningful work of the same quality is the catalyst for all sorts of feelings and demands for government intervention.
Do you see the slide? From a valid totaling up of wins and losses for one individual turned into a model involving segments of society.
It’s important to declare which model is in play as this dictates whether the players are individuals or groups, whether the tally of net benefit or loss is assigned to one or to many, and perhaps most interestingly the flow of reaction and counterreaction as value settles in the system. More interesting insights surface when consequential outcomes are looked at in a flow of events.
Think back to the time of the 2008 recession. Say one buyer purchased a home at the peak of the housing market with a three-year adjustable ARM. When the ARM recalculated in 2011, the buyer’s payment adjusted upwards to an amount beyond their ability to pay. Due to the recession, the value of the home had decreased below the mortgage balance. The buyer ends up in a familiar situation at that time and loses the property to foreclosure. This is a clear loss.
But say every other homeowner in the neighborhood had owned their homes for more than ten years. None of them were interested in selling until after 2015. These individuals realized no impact from the value changes during the recession expcept to see their assessed values decline resulting in lower property taxes. As a neighborhood the effects of the recession were uneventful.
In the plant closure story, there were most probably workers who ended up better off for the closure. Perhaps it encouraged them to return to school to achieve an updated skill. At the other end of work life, perhaps someone nearing retirement ended up with a more favorable retirement package. Getting people to think of workers as a mass might be useful for unions, but loses a finess of obeservation for analysis.
It seems, to have a profitable discussion, one must pick a playing field. If you want to pick a town, then the players are all the workers, their economic impact on local services, and the support available through the municipality’s local services. Who netted out what and where did the money settle in time periods 1, 2, and 3 following a plant closure. If there was a draw of support from a higher level of governance, maybe the playing field needs to be moved up a rung to the county level, or to the region within the state. The players then get expanded to blend in other economic agents and their positive and negative tallies.
Instead, the story is usually told like some mid-19th century Russian novel. The peasants were persecuted and the capitalists must be blamed! This is not helpful.
Allison Shertzer takes issue with the headline’s cryptic economic message. If there is enough housing, then the price for occupancy should settle to the price each resident can afford. If there are fifty homes in a settlement and fifty households, then those who can pay the most pick first, and down the line, the pricing match shuffles until the last match of the least desirable to the household to those with the least resources. This simplified balance market omits nuances like how two homes are tied up when people transition from one property to another. Or that when major renovations are underway, it is difficult to live on the property, so it is vacant.
The basic premise, however, is that when there are sufficient structures to shelter every household, the price to live in those structures is pushed through the system to reflect consumers’ ability to pay. After all, even at the lowest end of the scale, it would be better for the property owner to receive some income from a less advantaged person than to let the property sit vacant.
Or is it?
It is refreshing to see a study confirming that dwellings are, in the big picture, available in sufficient numbers. “The numbers showed that from 2010 to 2020, household formation did exceed the number of homes available. However, there was a large surplus of housing produced in the previous decade. In fact, from 2000 to 2020, housing production exceeded the growth of households by 3.3 million units. The surplus from 2000 to 2010 more than offset the shortages from 2010 to 2020.”
This article tries more than most to zero in on what is concerning. It’s not affordability in general. When ten parties are bidding on a house, that tells us there are plenty of households who find the price within their range of acceptability. When houses are selling, and apartments are rented, then folks have the funds to make those arrangements work.
What is of concern, and has always been of concern, is sheltering those at the very lowest of means. This brings us back to the question: If there are open units to occupy, is there a reason why they would be left vacant instead of settling for some cash flow? Yes, there is a reason. In some cases, the net monthly cash flow is negative. The issue is being talked about as if it concerns the building, but it’s really about the necessity of support services.
It would be even more refreshing if the conversation went in that direction instead of hammering away about building affordable housing, which is another cryptic economic fallacy.