
Check out what the Minneapolis Federal Reserve Bank has put together.
The dashboard features both contextual and market-based indicators across seven key categories: household demographics, housing characteristics, production, price of housing, housing cost burden, stability, and local tax base. Integrating data from a combination of national sources, such as the U.S. Census Bureau’s American Community Survey and the U.S. Department of Housing and Urban Development, and local sources, like the Metropolitan Council and HousingLink, the dashboard captures more than 30 unique indicators. For each indicator, users can view Saint Paul’s trends over time, compare Saint Paul to its surrounding cities, and benchmark it to similar cities across the nation to gain a holistic understanding of the Saint Paul housing landscape.
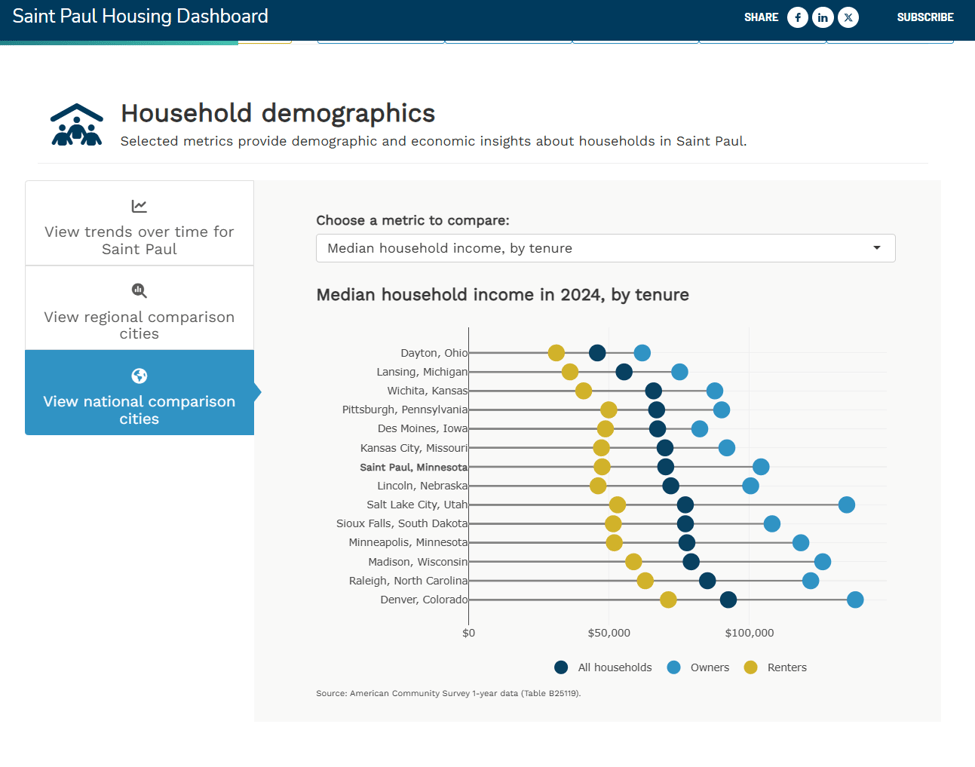
The dashboard offers the well-worn data of price and income, but you can easily pull national comparisons.
The Saint Paul Housing Dashboard and our qualitative conversations with housing owners and developers further the Minneapolis Fed Community Development and Engagement team’s understanding of how housing supply affects housing affordability. As such, this analysis supports our team’s mission to advance the economic well-being of low- to moderate-income individuals, households, and communities. The better we understand local housing markets that have seen recent policy changes—like Saint Paul—the better we can pursue the Minneapolis Fed’s overall mission to pursue a growing economy and stable financial system that work for all of us.
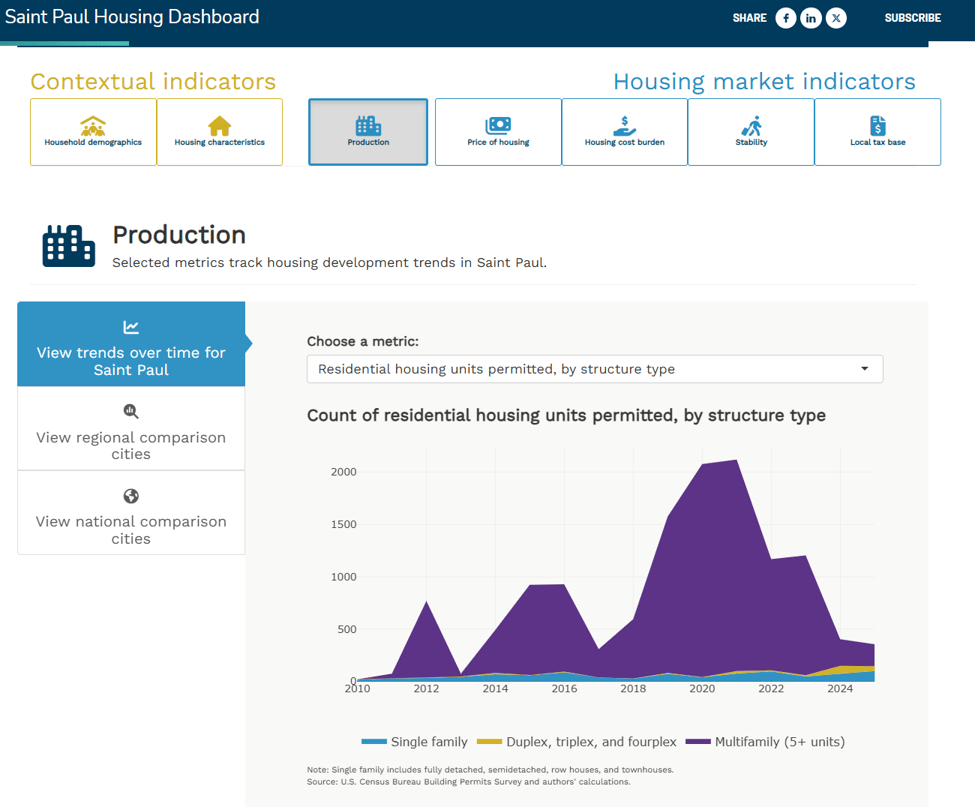
There are options to pull data on housing production.
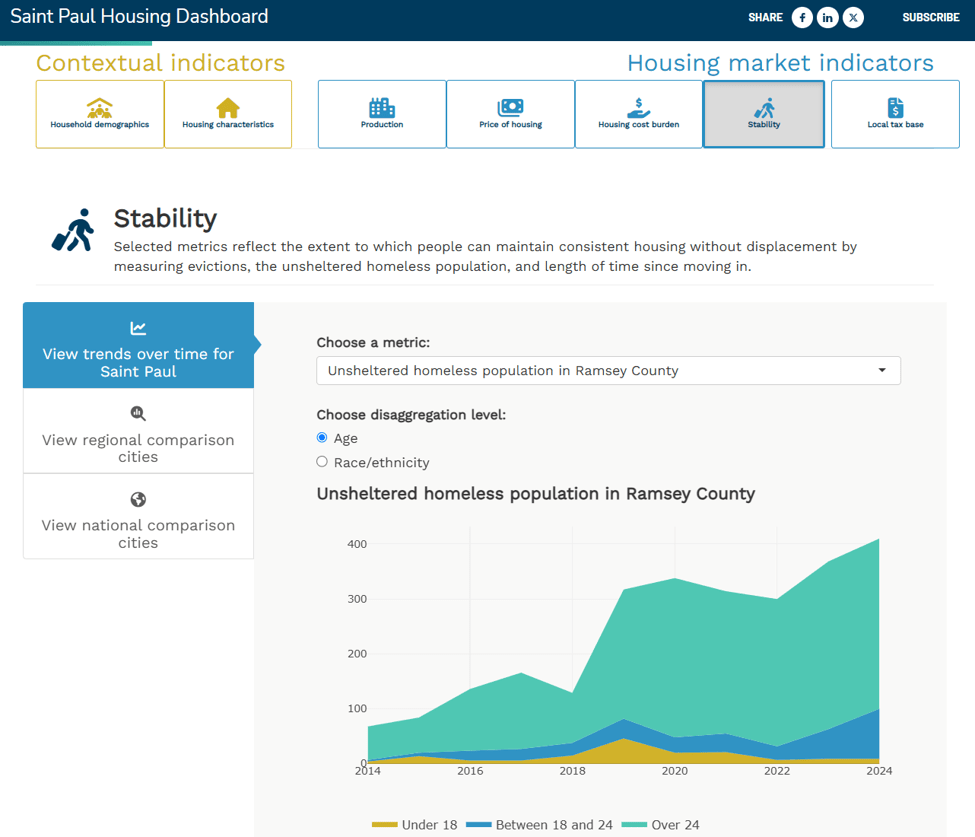
Or, you can check in on the numbers who are without housing altogether.
The dashboard offers many new ways to view the data.
