Is Rural Housing Really Unaffordable? The Numbers Tell a Different Story
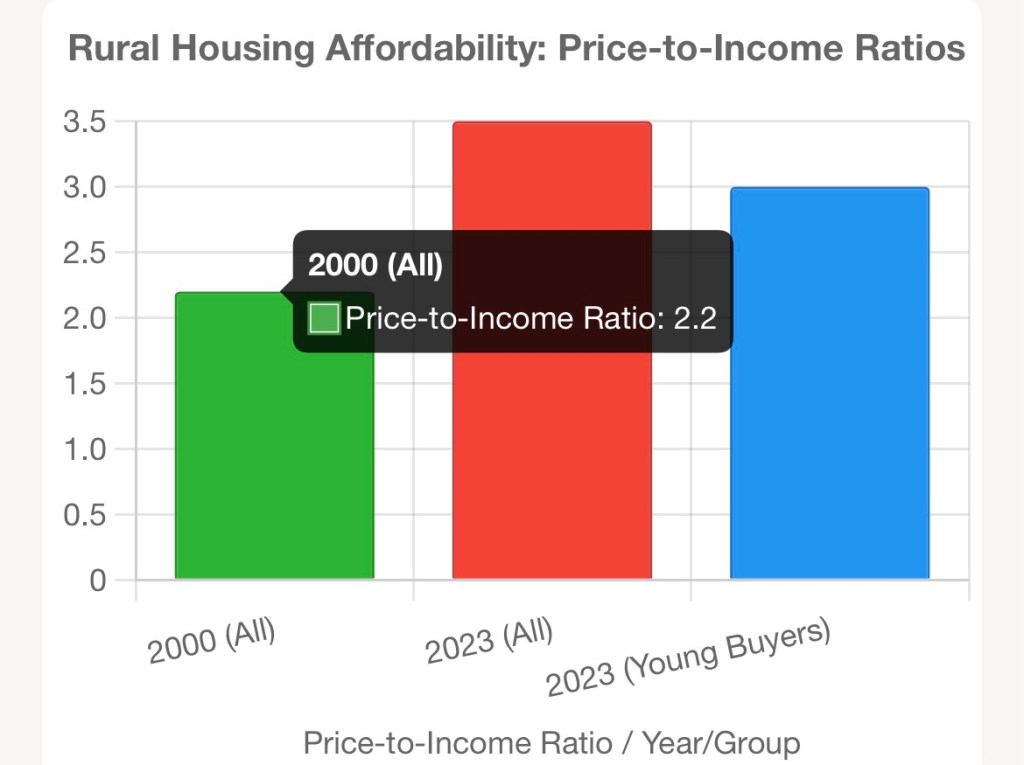
A recent Council of Economic Advisers (CEA) report claims rural housing affordability has plummeted, with charts showing a 75.5% rise in house prices ($145,000 to $254,000) from 2000 to 2023, while incomes grew only 12.3% ($65,000 to $73,000). This suggests a price-to-income ratio jumping from 2.2 to 3.5, implying homes are much harder to afford. But the charts mislead by lumping everyone together, hiding who’s really affected.
The CEA’s charts (Figures 5 and 6) plot real income and house prices for all rural homeowners, suggesting everyone faces a $254,000 price tag. Here’s the catch: only about 7% of rural homes (~1.6 million households) are sold each year. Most homeowners have fixed costs from years ago, like a $145,000 mortgage from 2000, and aren’t hit by today’s prices. Even worse, only a third of those sales—about 2% of all homes—are to first-time buyers, who truly face the 3.5 ratio. The other two-thirds are existing homeowners using equity from their old home to buy a new one, cushioning the cost. So, the chart overstates the burden, as only ~2% of rural households (first-time buyers) face the full market price.
Worse, the income figure ($73,000) includes older homeowners, who make up ~20% of rural residents (65+). Many own their homes outright, with low costs (e.g., $2,540/year in taxes on a $254,000 home) and low incomes (e.g., $30,000 from pensions). This drags down the median income, inflating the 3.5 ratio. Young buyers (25–45), earning ~$85,000, face a better ratio (~3.0), showing the problem isn’t as dire for them.
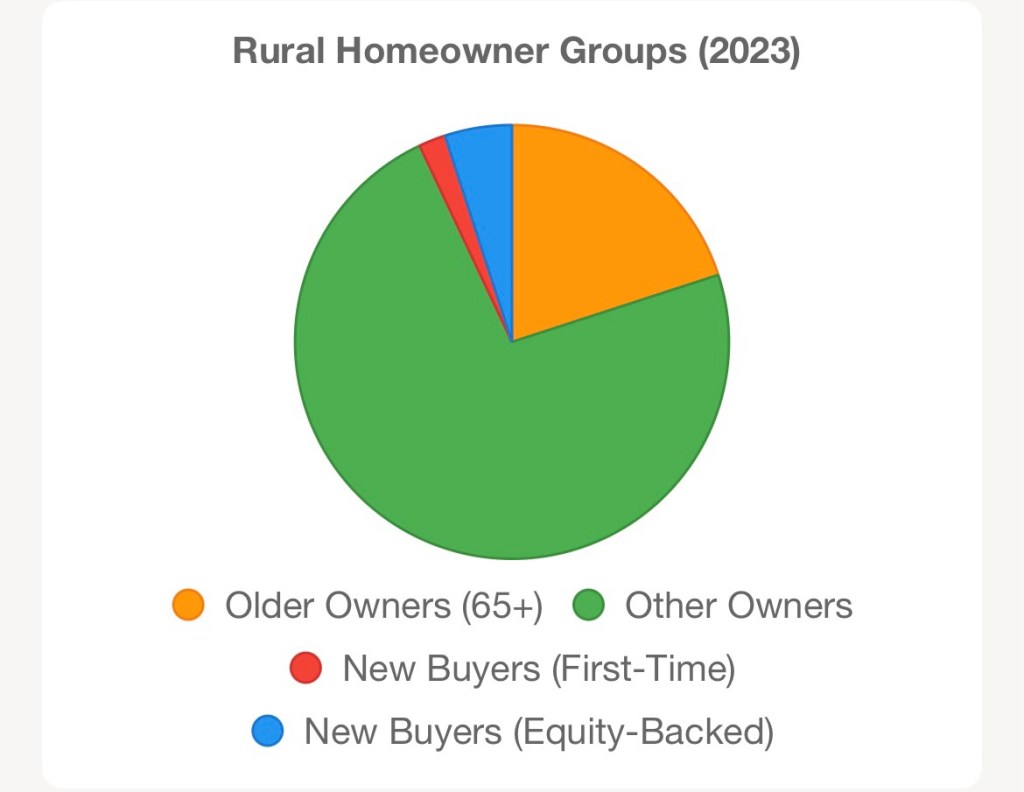
Picture a bar chart: in 2000, the price-to-income ratio was 2.2 for all. In 2023, it’s 3.5 for everyone (per the CEA), but only 3.0 for young buyers. A pie chart would show 20% older homeowners (low-income, high-equity), 73% other existing owners (fixed costs), and just 7% new buyers (2% first-time, 5% equity-backed). By mixing everyone into one pool, the details are drowned out.
Prices have gone up. They are set by the purchasing abilities of those entering the market. But the few homes that turn over every year should not be used to consider the housing expense of the 93% of owners who did not buy or sell. That obligation was set years prior in a different market.
