The US Census has a new look. The site has improved tremendously. This might be old news, but it’s news to me. It’s worth checking out if you haven’t been there in a while. I particularly like the profile pages, like this one.
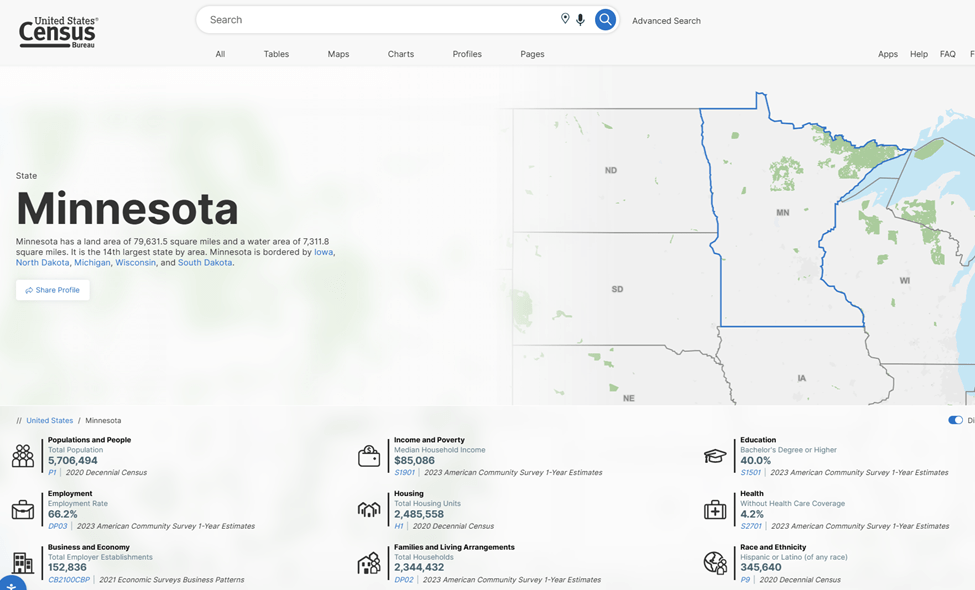
Take note of the breakdown of housing units and households. There are approximately 5.7% more housing units than households in the state. You need some vacancies as there are units under renovation or being held while a family relocates from one living situation to another. Is 5.7% in the comfortable range? It’s hard to know. Still– comparing the spread between households and units is a measure to determine how many extra spaces, if any, there are for families to live.
The county-level profiles are great too and come in several formats. Here are three to compare.
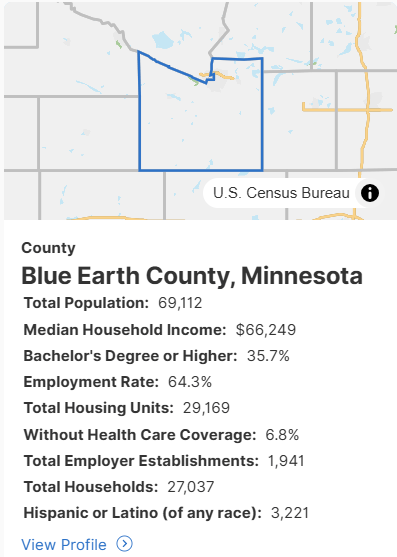

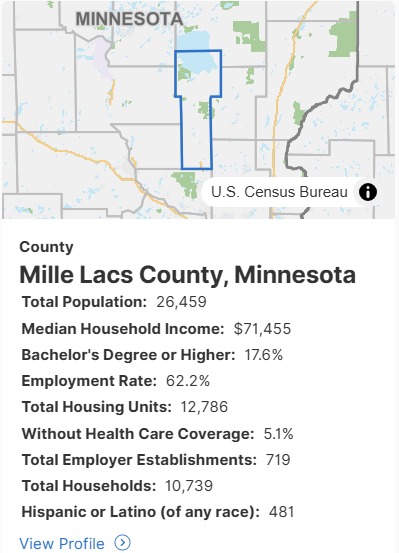
Each county has a different spread between the number of housing units and the number of households. The range is from 7% vacancy in the agricultural area of Blue Earth to a low of 1.8% in the most densely populated Hennepin County to a generous 16% in the northern lakes area of Mille Lacs County. Hennepin County is the only place we can say with certainty that there is a clear need for more housing.
Counties are large. There may be vacant structures in rural Blue Earth county while the demand for places to live is in Mankato, a nice-sized town of forty-five thousand. For that reason, it’s great that the Census even zooms into the city level.
Here’s a snapshot of Perham, a small but humming town about an hour SE of Fargo.

The point here is that housing is local. When people observe that the price of housing did not come down when new units were added, the follow-up question should be, what type of housing and where?
