In June the Joint Center for Housing Studies at Harvard puts out a national report. Six months on, I thought it might be interesting to check in on a few of the trends.
If you were involved with anything around new construction in 2021 you were acutely aware of the steep uptick in lumber prices. By spring market builders were writing upcharge clauses into purchase agreements allowing them to carry that cost back to the consumer at the end of the build. This did not always go over well.
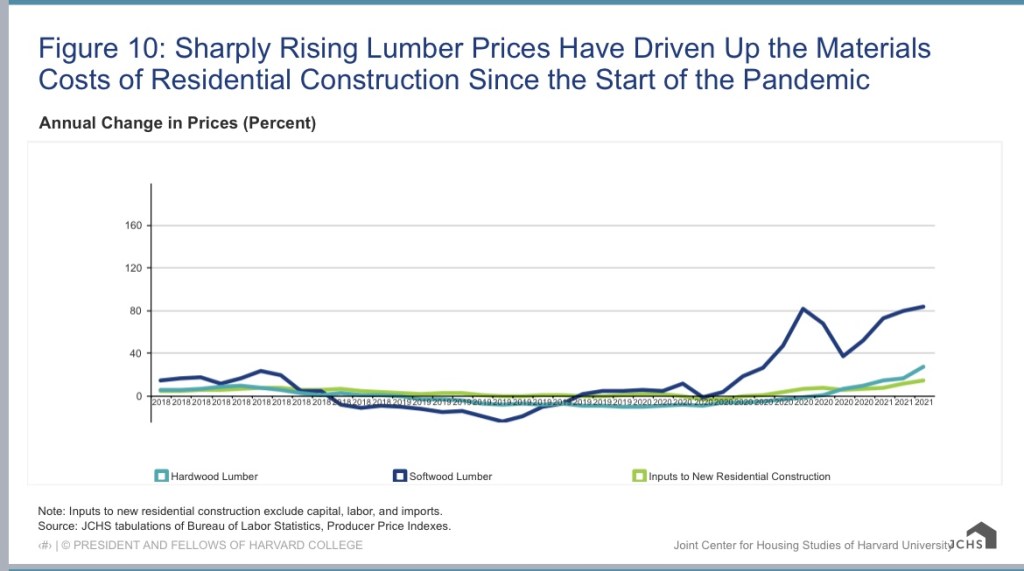
I called a lumber yard recently regarding a bid on some pre-stained poplar for a tongue and grove ceiling. The guy on the other end of the line said prices had edged down a bit but he thought this particular product was still carrying a 22 percent surcharge over a year ago. He couldn’t predict into spring but said they all hoped the prices would ease and availability increase.
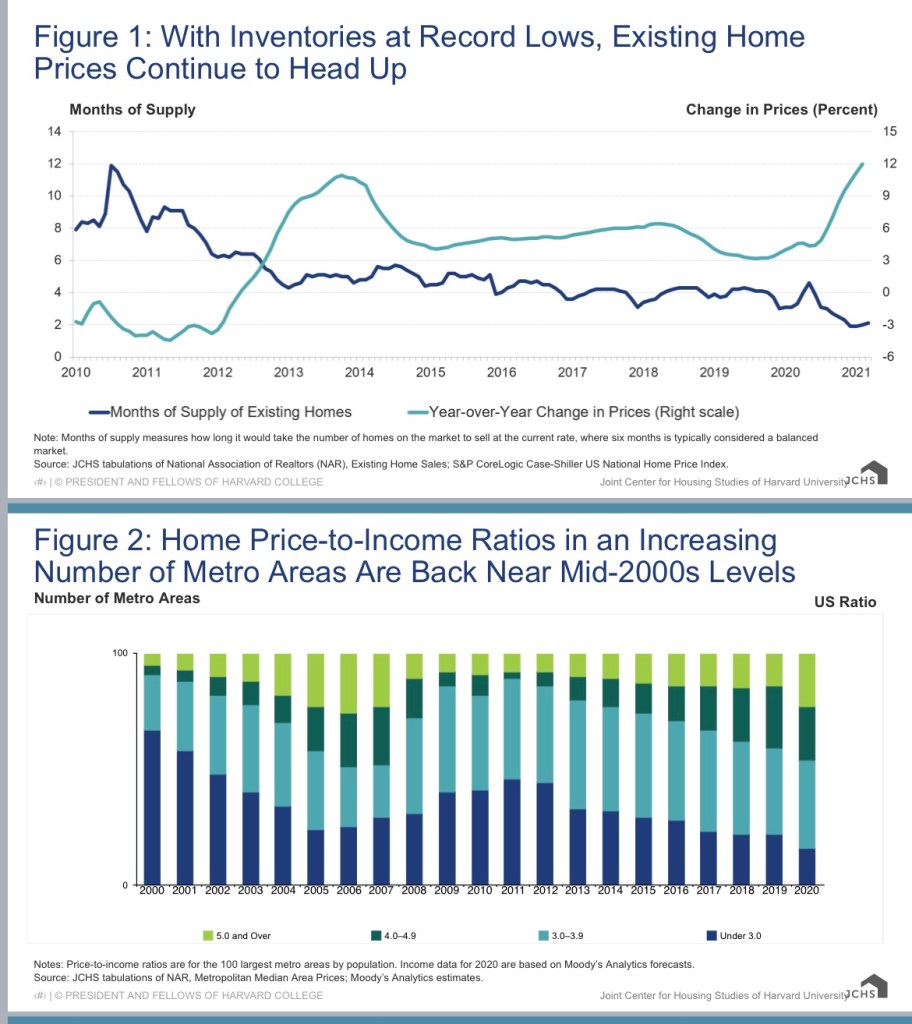
The other big news of the last eighteen months is the continued pressures on price. Even coming into the winter months new listings are selling in multiple offers. That said, I’m glad the study includes the second chart which shows how the cost of housing lines up with the income available to homeowners to make their payments. The cost of housing is not out pacing the potential to pay for it, but simply keeping pace. This should ease concerns around bubbles.
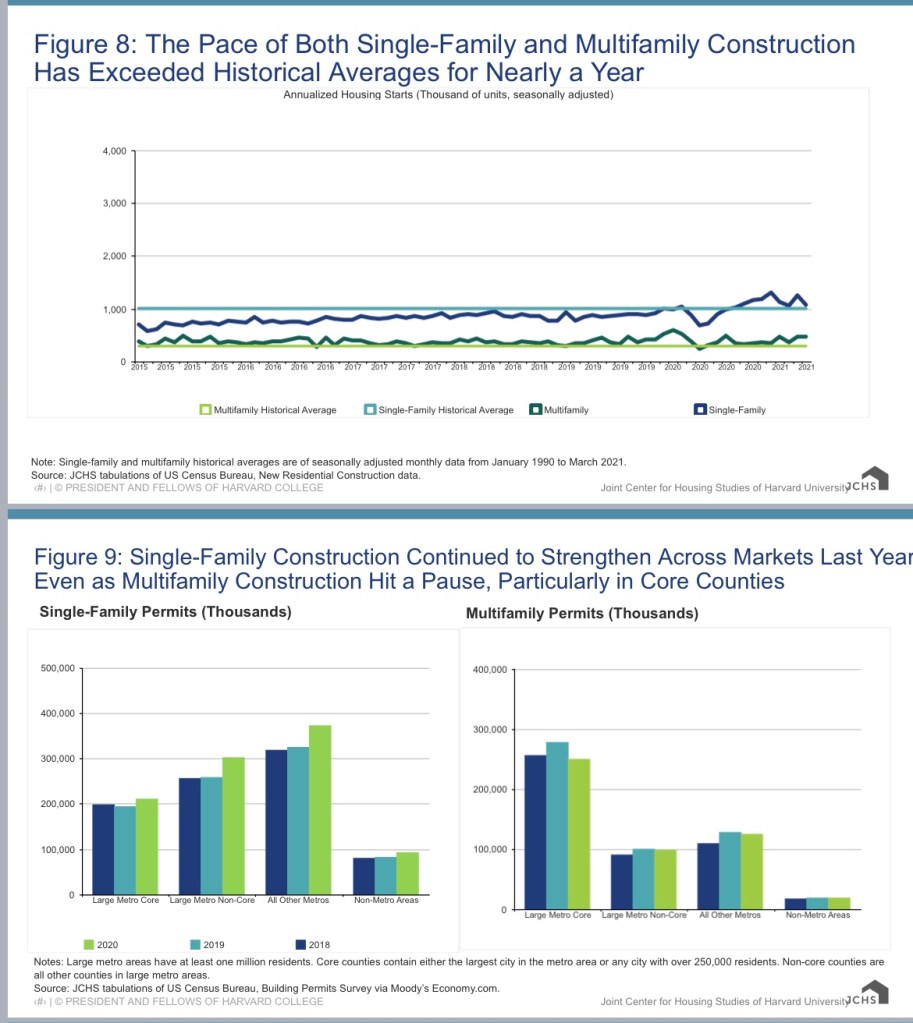
This last chart was news to me. I was not aware that new construction trends have been above historical averages for over a year. This is encouraging! I’d say we need an even bigger push for more units as millennials are finding their way to household formation. At least the numbers are trending upwards.
Several pieces of data that I would be interested in tracking is 1. how many units are idle and not in use 2. the trends for people aging out of home ownership making those units available, and 3. the number of units thought to be inhabitable. All of these numbers would help track ongoing availability of shelter.
